
- Moving the markets
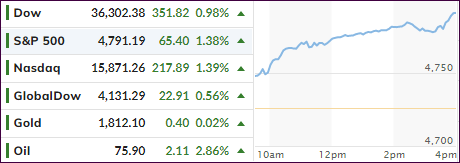
Last week’s upward momentum picked up steam today with the bulls clearly being in charge and pushing the major indexes higher with the S&P 500 scoring another record.
Despite a surge in Covid cases, the mood remained buoyant, at least in terms of equities, with some analysts expecting no lasting or meaningful Omicron impact on the growth outlook.
Again, the focus remains on the historical fact that, more often than not, the major indexes have sored solid gains during the last 5 trading days of the year and the first 2 of the new year. This period started today.
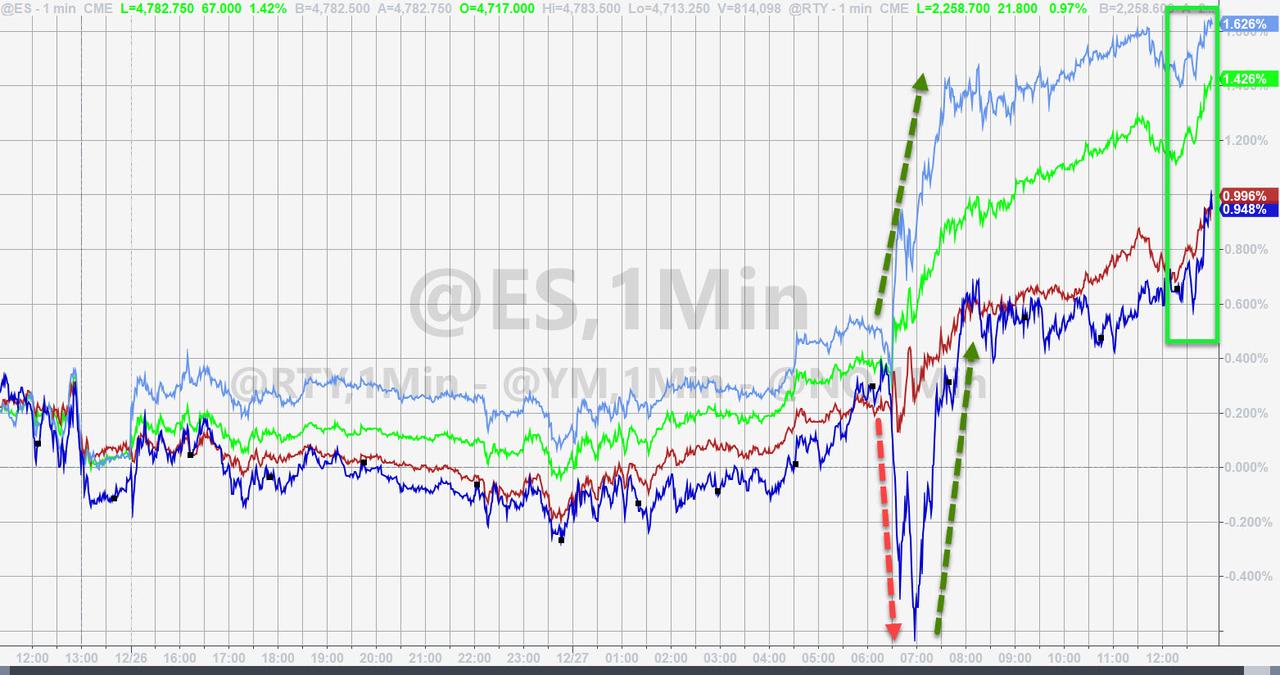
The session begun with a divergence, as the Nasdaq spiked higher, while SmallCaps were slammed, with the latter recovering later but trailing the former’s gain of 1.39% by a wide margin. The S&P 500 came in second place with a solid advance of 1.38%.
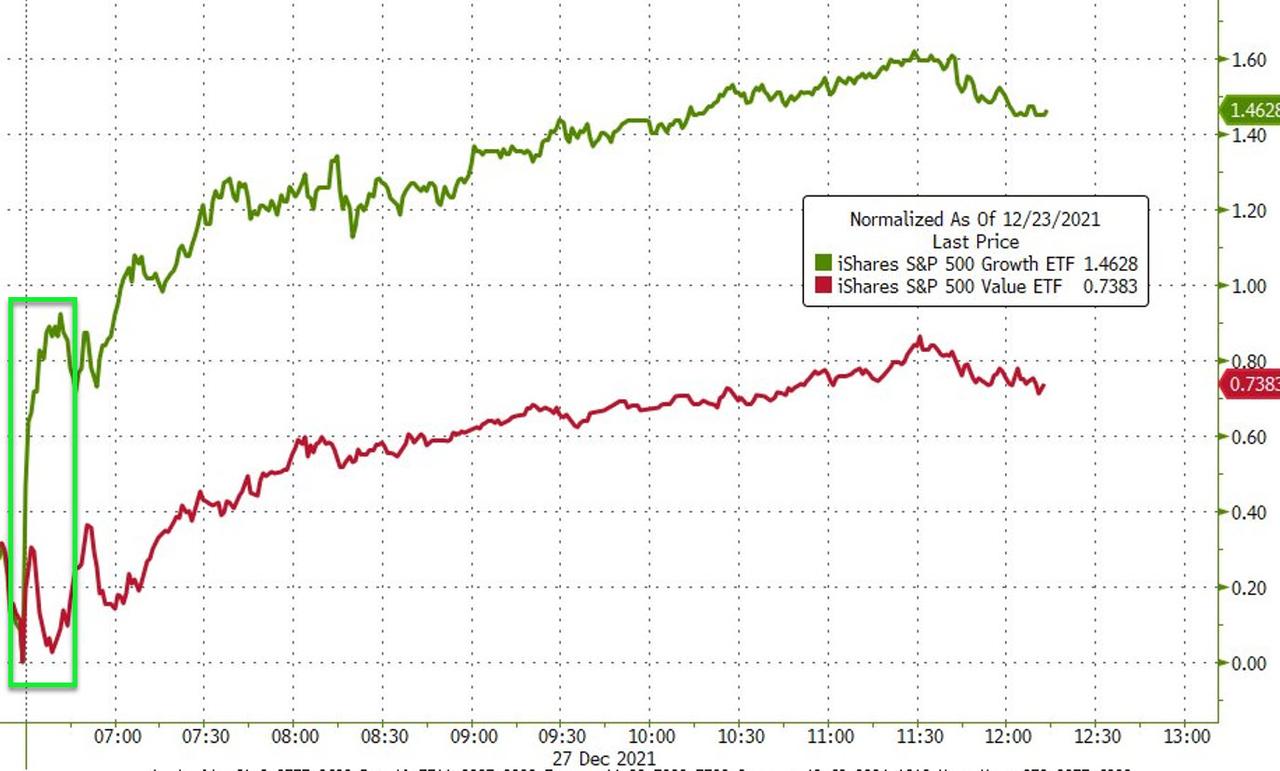
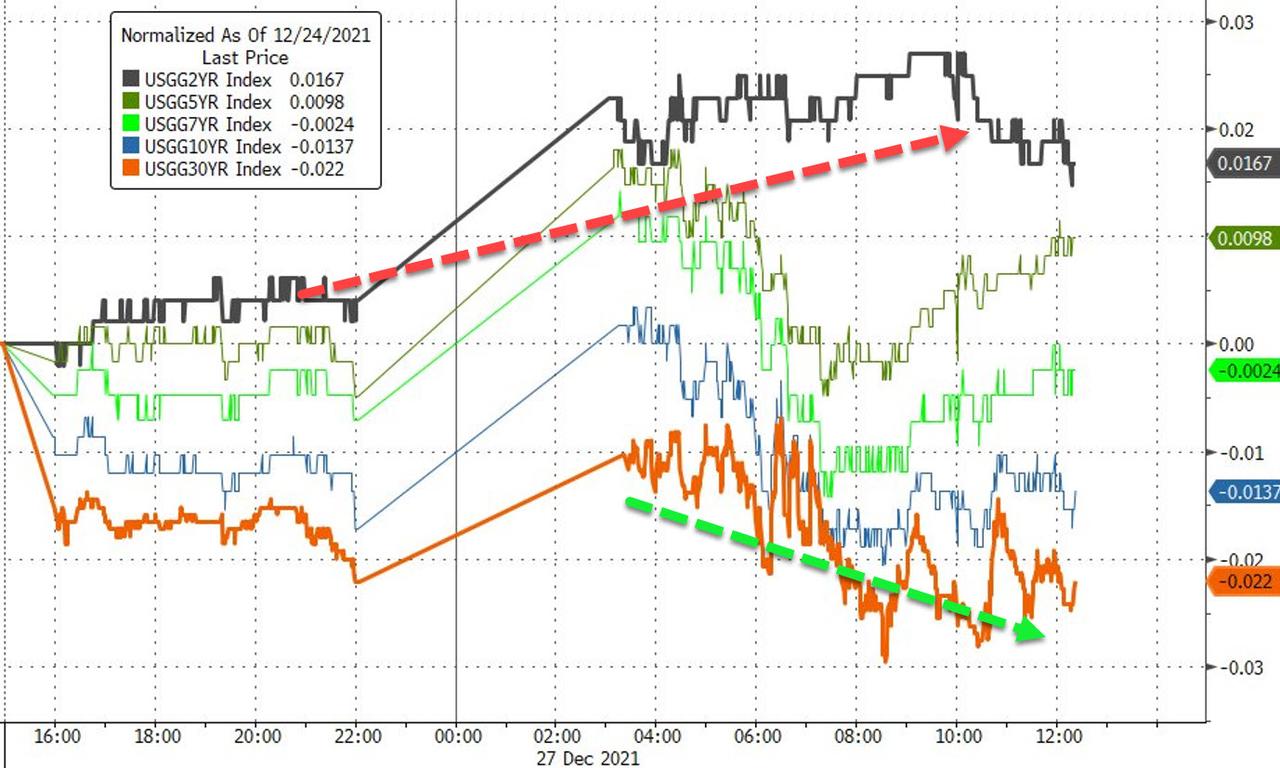
When rallies shift into overdrive, it’s no surprise to see “growth” outperform “value,” and today was no exception. Bond yields were mixed, went sideways, and stayed below their respective unchanged lines.
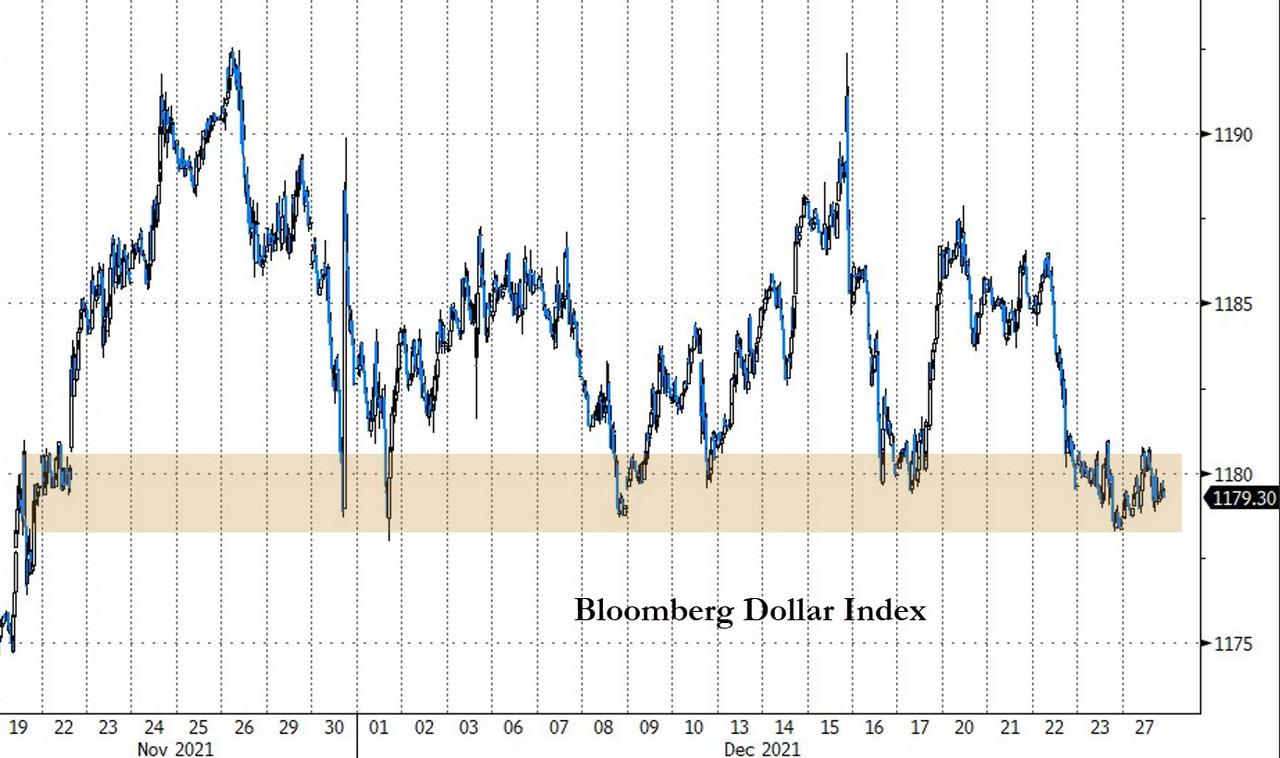
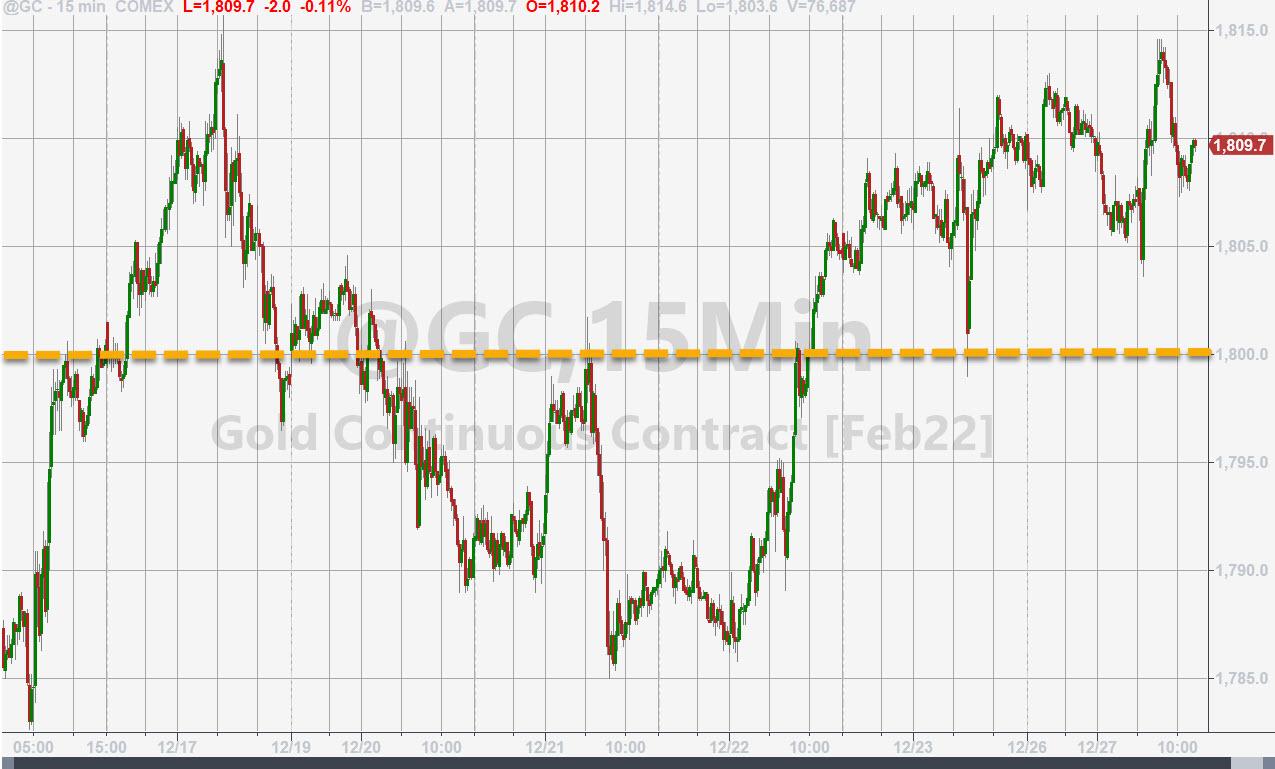
The US Dollar went nowhere and remained stuck at recent support levels, as ZeroHedge pointed out. Gold was flat but managed to successfully defend its $1,800 level.
In the end, there were no major news items affecting market direction thereby giving the bulls another day of dominance.
2. ETFs in the Spotlight
In case you missed the announcement and description of this section, you can read it here again.
It features some of the 10 broadly diversified domestic and sector ETFs from my HighVolume list as posted every Saturday. Furthermore, they are screened for the lowest MaxDD% number meaning they have been showing better resistance to temporary sell offs than all others over the past year.
The below table simply demonstrates the magnitude with which these ETFs are fluctuating above or below their respective individual trend lines (%+/-M/A). A break below, represented by a negative number, shows weakness, while a break above, represented by a positive percentage, shows strength.
For hundreds of ETF choices, be sure to reference Thursday’s StatSheet.
For this current domestic “Buy” cycle, here’s how some our candidates have fared:
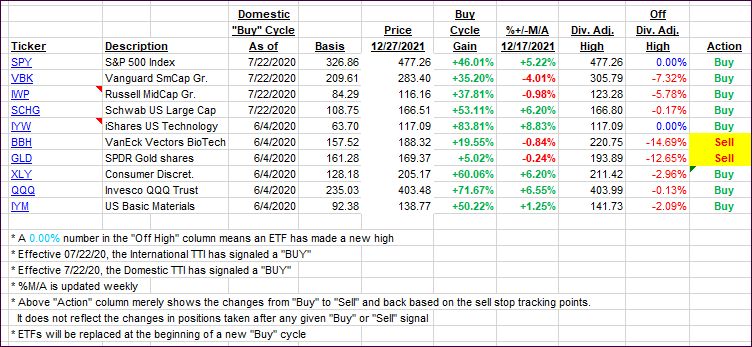
Click image to enlarge.
Again, the %+/-M/A column above shows the position of the various ETFs in relation to their respective long-term trend lines, while the trailing sell stops are being tracked in the “Off High” column. The “Action” column will signal a “Sell” once the -8% point has been taken out in the “Off High” column. For more volatile sector ETFs, the trigger point is -10%.
3. Trend Tracking Indexes (TTIs)
Our TTIs ramped higher, because the Santa rally continued unabated.
This is how we closed 12/27/2021:
Domestic TTI: +6.53% above its M/A (prior close +5.19%)—Buy signal effective 07/22/2020.
International TTI: +2.94% above its M/A (prior close 2.38%)—Buy signal effective 07/22/2020.
Disclosure: I am obliged to inform you that I, as well as my advisory clients, own some of the ETFs listed in the above table. Furthermore, they do not represent a specific investment recommendation for you, they merely show which ETFs from the universe I track are falling within the specified guidelines.
All linked charts above are courtesy of Bloomberg via ZeroHedge.
Contact Ulli