
- Moving the markets
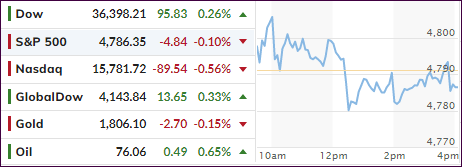
After the recent ramp-a-thon, it was to be expected that the markets would consolidate a little bit, which is exactly what happened today. While the Nasdaq gave back 0.56%, the S&P 500 ended just about unchanged, but the Dow eked out a tiny gain thereby recording its 5th day of advances.
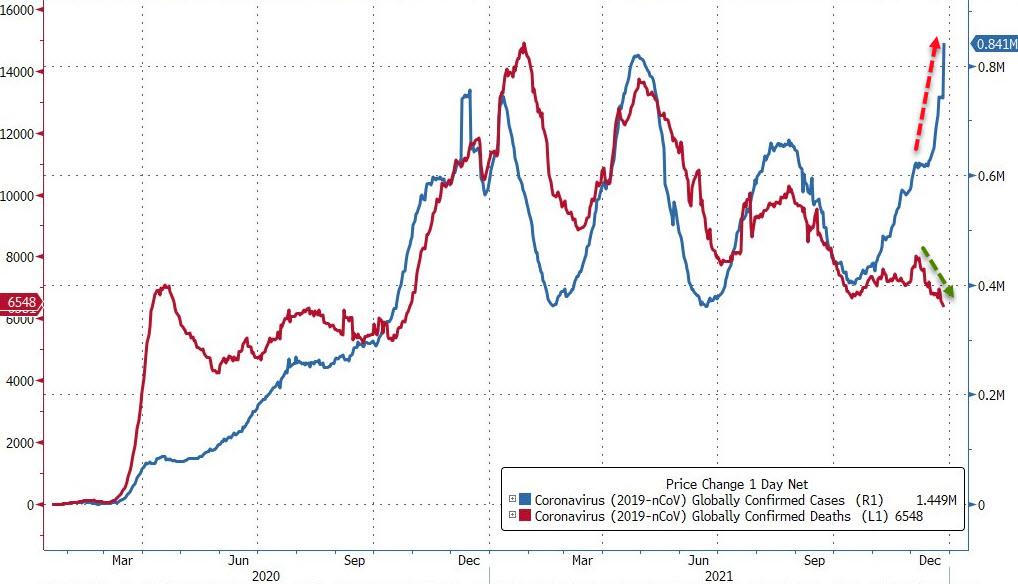
However, upward momentum remains in full force with our TTIs (section 3) still being firmly entrenched on the bullish side of their respective trend lines. Driving market direction are the latest pandemic news, with Omicron, aka “Omicold,” being hyped by MSM despite its mild effects.
Added ZeroHedge:
Stocks were supported early by the headlines that the CDC relaxed the quarantine guidelines for people with COVID-19 yesterday, reducing the number of days in isolation from 10 to 5 – another potential sign we may be transitioning to ‘living with virus’ normalization, but as the cash market opened Small Caps and Big Tech were dumped while The Dow pumped.
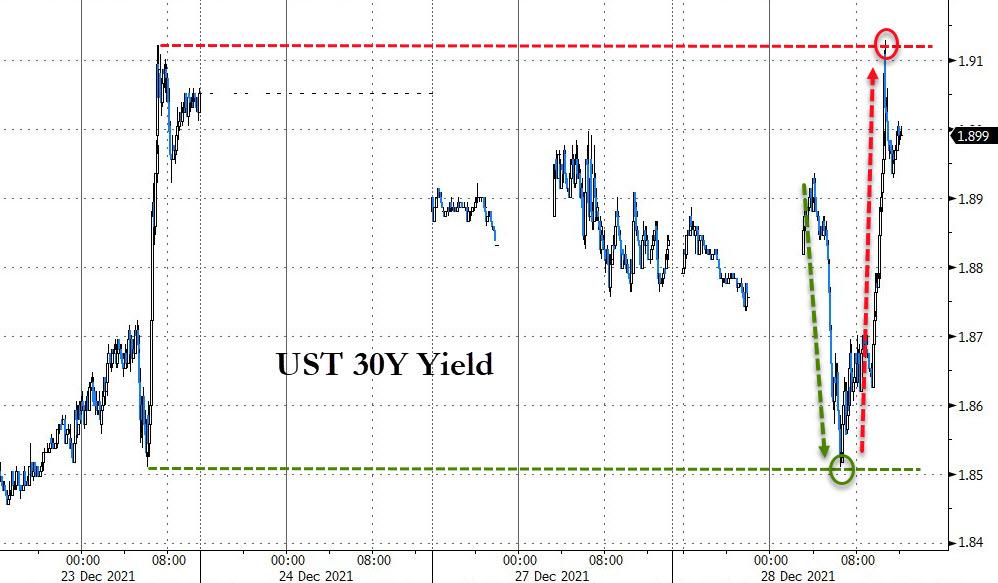
Bonds were in a world of their own with the 30-year redefining the term “rollercoaster,” as its yield swung wildly and ended up at the highs for the session.
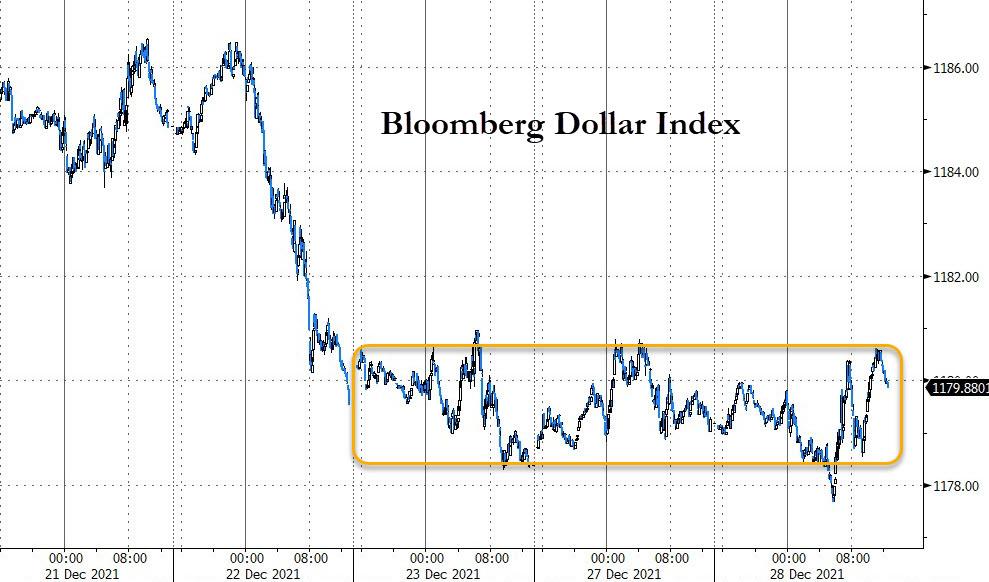
Both, “SmallCaps” and “growth” succumbed to weakness, while “value” prospered for a change with RPV gaining 0.49%. The US Dollar repeated yesterday’s sideways pattern and went nowhere. Gold dropped a tad but hung on to its $1,800 level.
2. ETFs in the Spotlight
In case you missed the announcement and description of this section, you can read it here again.
It features some of the 10 broadly diversified domestic and sector ETFs from my HighVolume list as posted every Saturday. Furthermore, they are screened for the lowest MaxDD% number meaning they have been showing better resistance to temporary sell offs than all others over the past year.
The below table simply demonstrates the magnitude with which these ETFs are fluctuating above or below their respective individual trend lines (%+/-M/A). A break below, represented by a negative number, shows weakness, while a break above, represented by a positive percentage, shows strength.
For hundreds of ETF choices, be sure to reference Thursday’s StatSheet.
For this current domestic “Buy” cycle, here’s how some our candidates have fared:
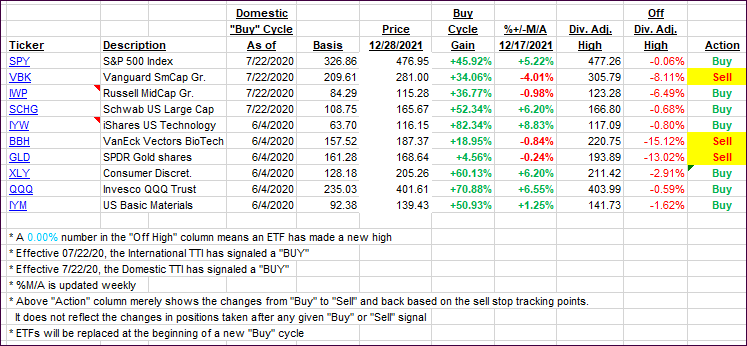
Click image to enlarge.
Again, the %+/-M/A column above shows the position of the various ETFs in relation to their respective long-term trend lines, while the trailing sell stops are being tracked in the “Off High” column. The “Action” column will signal a “Sell” once the -8% point has been taken out in the “Off High” column. For more volatile sector ETFs, the trigger point is -10%.
3. Trend Tracking Indexes (TTIs)
Our TTIs edged higher despite the markets treading water.
This is how we closed 12/28/2021:
Domestic TTI: +6.70% above its M/A (prior close +6.53%)—Buy signal effective 07/22/2020.
International TTI: +3.25% above its M/A (prior close 2.94%)—Buy signal effective 07/22/2020.
Disclosure: I am obliged to inform you that I, as well as my advisory clients, own some of the ETFs listed in the above table. Furthermore, they do not represent a specific investment recommendation for you, they merely show which ETFs from the universe I track are falling within the specified guidelines.
All linked charts above are courtesy of Bloomberg via ZeroHedge.
Contact Ulli