
- Moving the markets
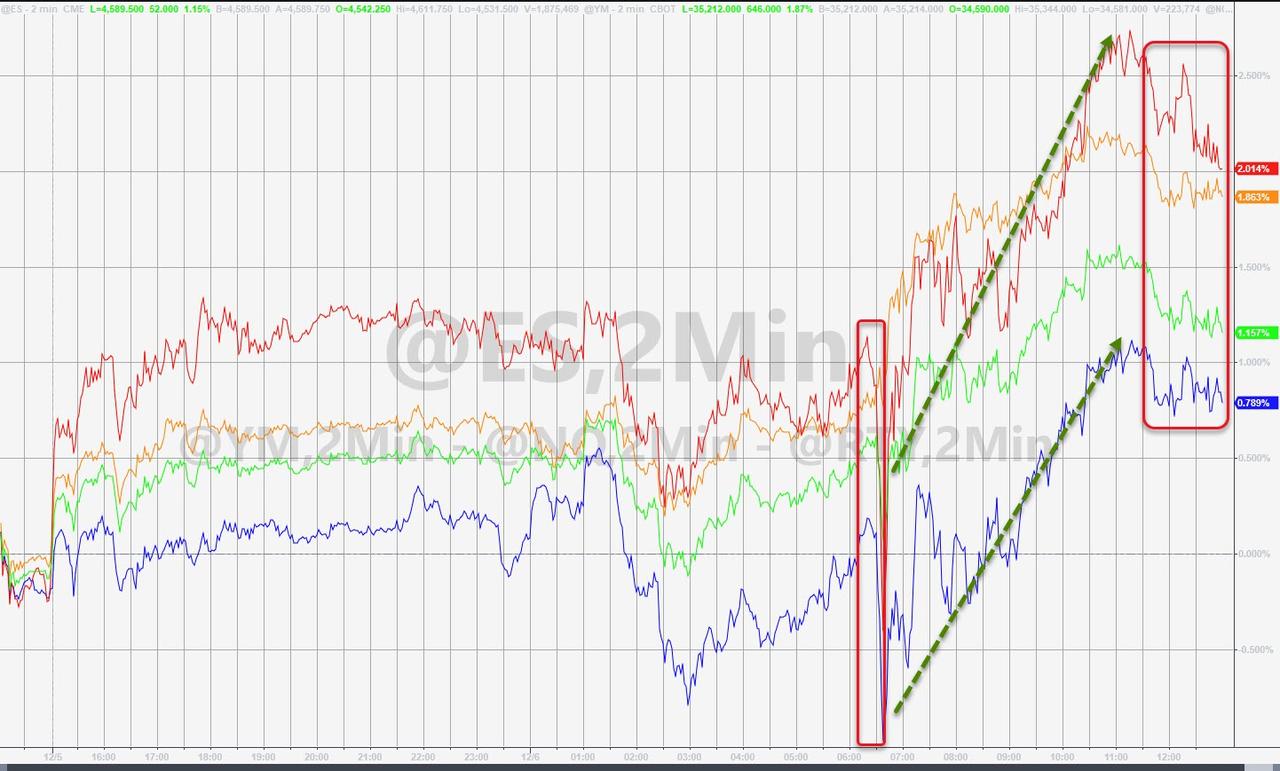
After wild rides in the markets last week, which saw early rallies wiped out later in the session, we finally witnessed an opening surge that improved throughout the day and did not peter out in the afternoon. Sure, momentum slumped a little into the close, but that can be expected.
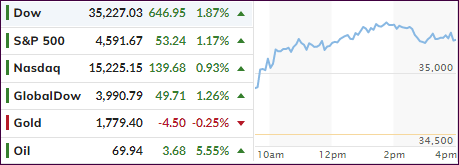
In the process, the Dow managed to erase all last week’s losses, while the S&P 500 just fell a fraction short. MarketWatch summed up today’s influencing forces like this:
- Shares linked to the economic reopening gained in Monday trading, including energy, industrials, and airlines.
- Investors continued to sell tech stocks with relatively high valuations. Those shares dragged the market down to a losing week on Wall Street last week.
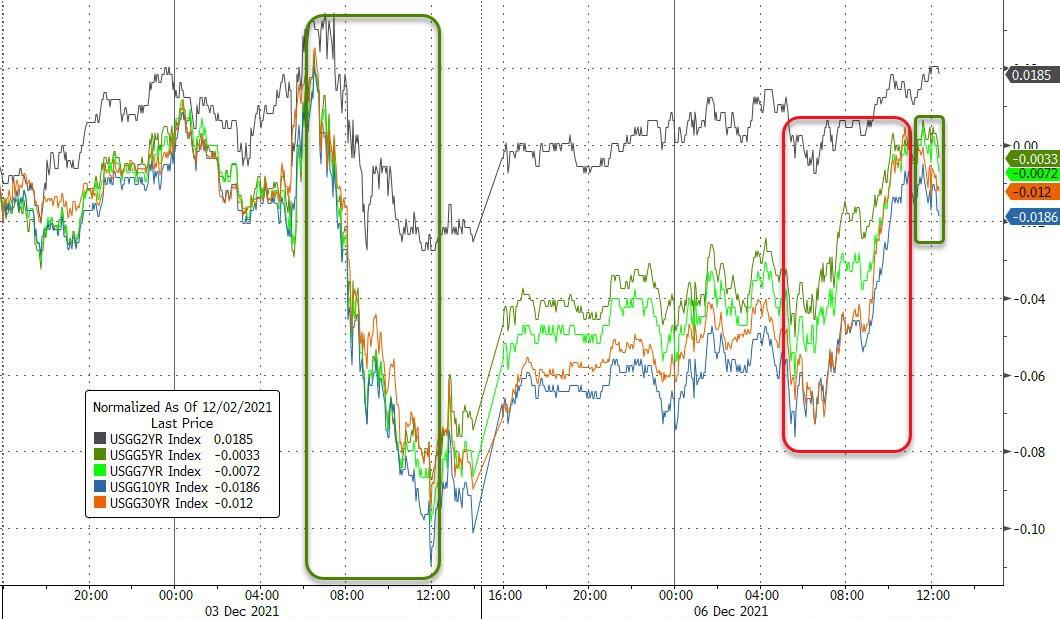
- The 10-year Treasury yield rebounded after falling last week amid the omicron threat.
- There’s a major shift underway at the Federal Reserve to bring about a faster end to its pandemic easing policies.
The Nasdaq lagged the other two major indexes as the health care and tech sectors were weighing down the indicator, with Moderna being the biggest decliner by shedding 15%.
Anxiety about the new Omicron variant remains, despite continuous reports of its symptoms being less severe, but fearmongering in the MSM seems to be always in high gear. It appears that any economic data are playing second fiddle to the latest headlines dealing with Covid 19 or its variants.
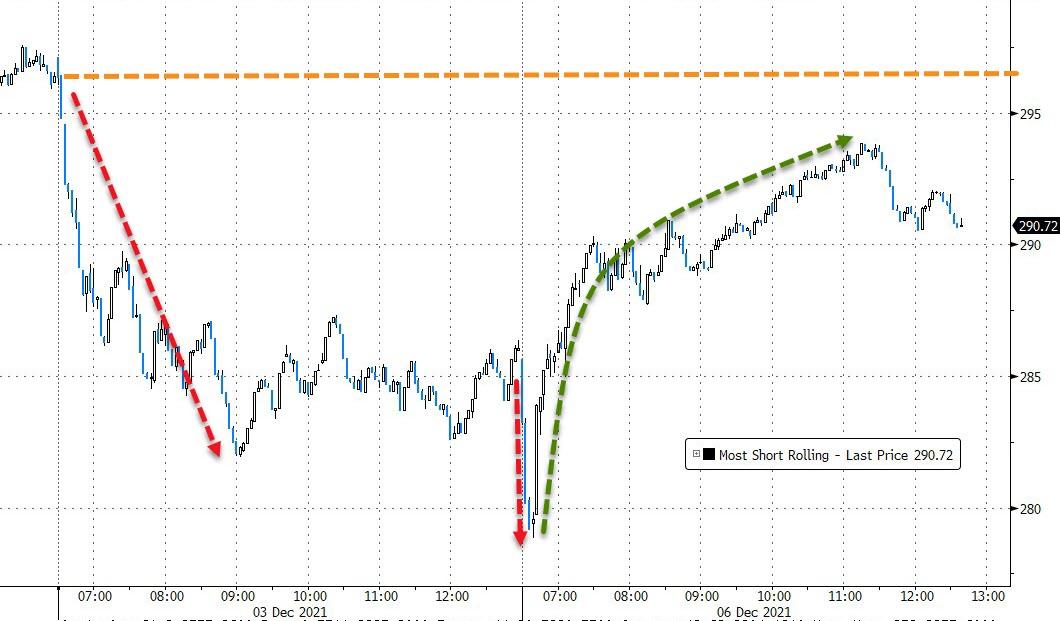
Finally, the short squeeze came back to life again, after being suspiciously absent during last week, and gave a much-needed assist to insure the rebound would not run out of steam.
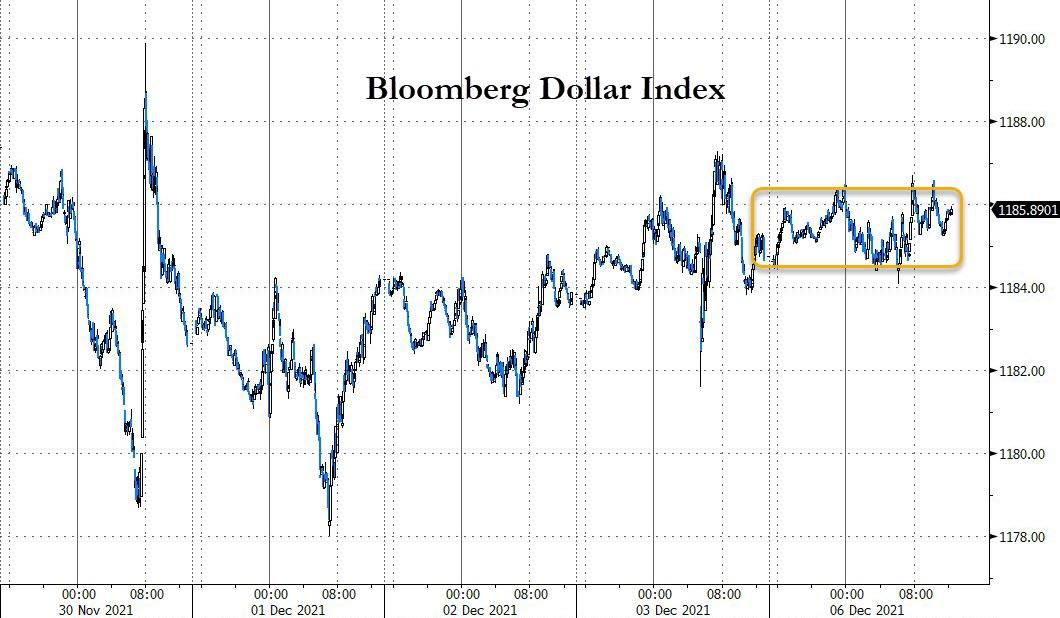
Bond yields surged after an early dump, with the 10-year eking out a small gain and closing the session at 1.48%. The US Dollar went sideways for most of the day but ended up higher by a modest 0.19%.
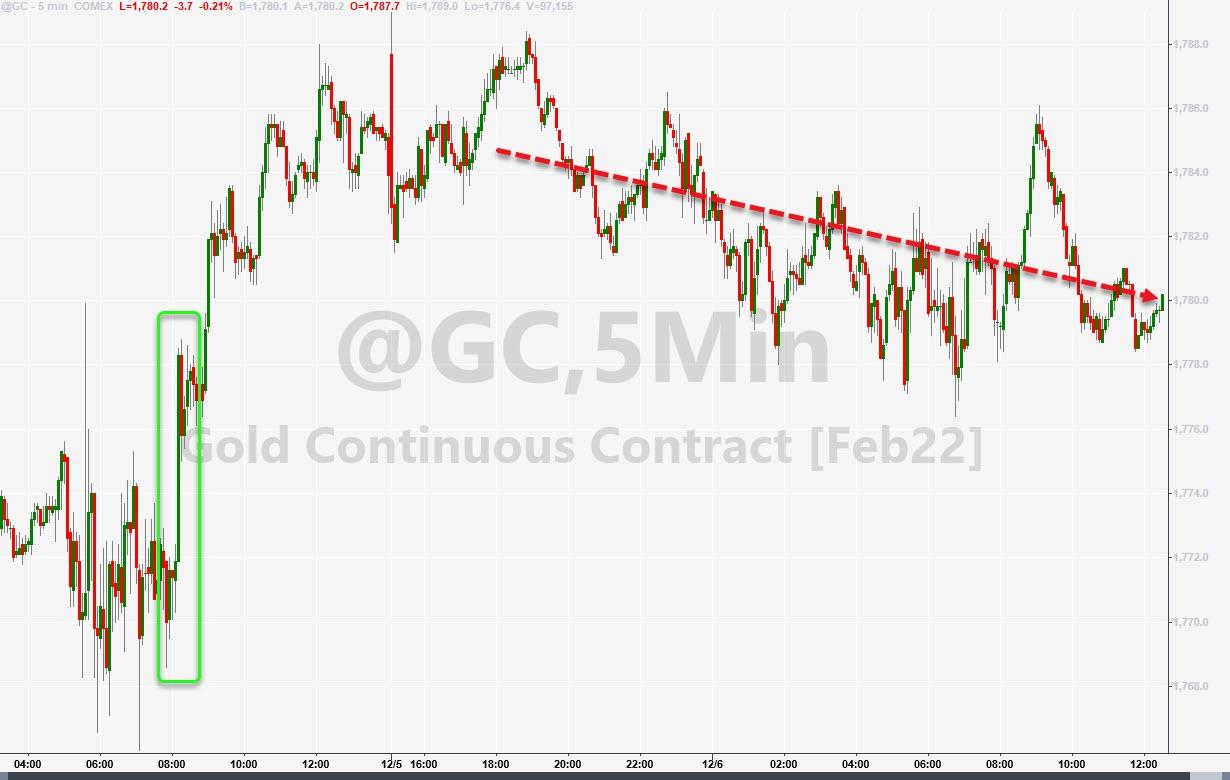
Gold drifted lower after Friday’s strong rebound with the precious metal giving back 0.24%, while still attempting to permanently conquer its much fought for $1,800 level.
I expect the recent volatility to stay with us, especially when on Friday the much-anticipated US CPI will be released.
2. ETFs in the Spotlight
In case you missed the announcement and description of this section, you can read it here again.
It features some of the 10 broadly diversified domestic and sector ETFs from my HighVolume list as posted every Saturday. Furthermore, they are screened for the lowest MaxDD% number meaning they have been showing better resistance to temporary sell offs than all others over the past year.
The below table simply demonstrates the magnitude with which these ETFs are fluctuating above or below their respective individual trend lines (%+/-M/A). A break below, represented by a negative number, shows weakness, while a break above, represented by a positive percentage, shows strength.
For hundreds of ETF choices, be sure to reference Thursday’s StatSheet.
For this current domestic “Buy” cycle, here’s how some our candidates have fared:
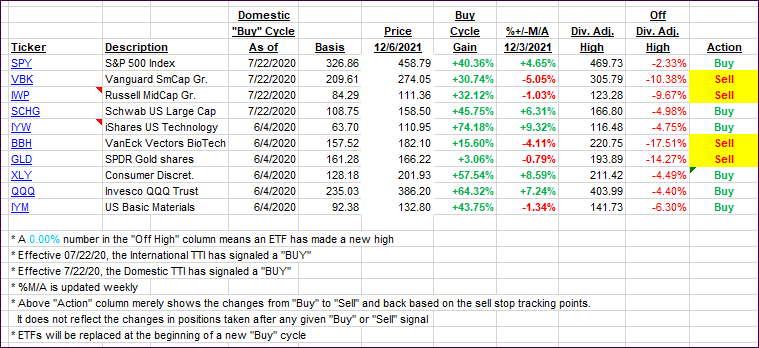
Click image to enlarge.
Again, the %+/-M/A column above shows the position of the various ETFs in relation to their respective long-term trend lines, while the trailing sell stops are being tracked in the “Off High” column. The “Action” column will signal a “Sell” once the -8% point has been taken out in the “Off High” column. For more volatile sector ETFs, the trigger point is -10%.
3. Trend Tracking Indexes (TTIs)
Our TTIs followed the positive theme in the market and recovered some of their recent losses. Even the International one is attempting to return to the bullish side of its trend line.
This is how we closed 12/06/2021:
Domestic TTI: +3.59% above its M/A (prior close +2.07%)—Buy signal effective 07/22/2020.
International TTI: -0.30% below its M/A (prior close -1.45%)—Buy signal effective 07/22/2020.
Disclosure: I am obliged to inform you that I, as well as my advisory clients, own some of the ETFs listed in the above table. Furthermore, they do not represent a specific investment recommendation for you, they merely show which ETFs from the universe I track are falling within the specified guidelines.
All linked charts above are courtesy of Bloomberg via ZeroHedge.
Contact Ulli