
- Moving the markets
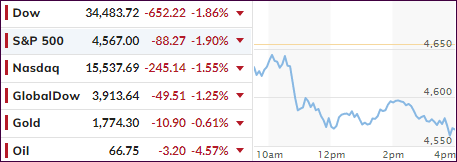
First, there was more fearmongering, as Moderna’s CEO raised doubts about the efficacy of the current batch of vaccines versus the omicron variant. That took the starch out of any bullish momentum and pulled the major indexes down.
Second, in a lesson to all economic hacks, Fed head Powell destroyed the long-held view that inflation is transitory by announcing the following:
“The economy is very strong and inflationary pressures are high and it is therefore appropriate, in my view, to consider wrapping up the taper of our asset purchases…perhaps a few months sooner,” Powell said, during testimony to the Senate Banking Committee.
Suddenly, the “transitory” inflation narrative, which I have countered all year long, came not only apart at the seams but as a total shock to traders and algos alike. Market reaction was fast and furious with the Dow dropping from barely being in the red to down 500 points within a minute, with the other indexes following suit.
In the end, the sell-off was broad and deep with no place to hide. Even gold, up some 1.25% early on, got hammered and closed lower by a moderate 0.48%, despite the 10-year bond yield sinking by 5.6 basis points to 1.44%.
The US Dollar resembled the chaotic activity of a penny stock by dumping, pumping and fading into the close.
We have now reached a point where the above narratives could very well continue and end this current bullish market cycle. As I posted before, the International TTI has at times been the canary in the coalmine by forecasting the fate of domestic equities. Please see the latest numbers in section 3 below.
Some trailing sell stops are close to being executed, and I believe that market action over the next few trading days will be indicative as to whether there will be a directional change or not.
Stay tuned.
2. ETFs in the Spotlight
In case you missed the announcement and description of this section, you can read it here again.
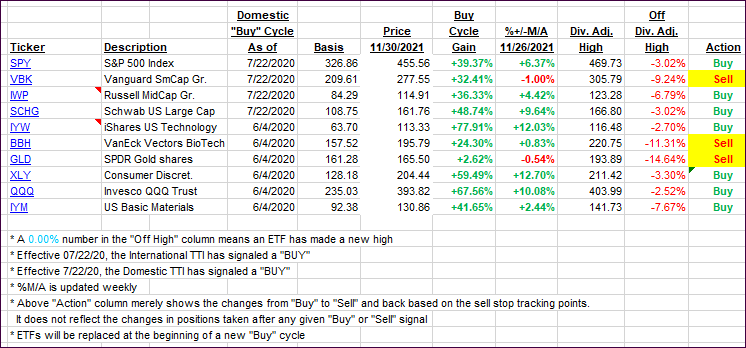
It features some of the 10 broadly diversified domestic and sector ETFs from my HighVolume list as posted every Saturday. Furthermore, they are screened for the lowest MaxDD% number meaning they have been showing better resistance to temporary sell offs than all others over the past year.
The below table simply demonstrates the magnitude with which these ETFs are fluctuating above or below their respective individual trend lines (%+/-M/A). A break below, represented by a negative number, shows weakness, while a break above, represented by a positive percentage, shows strength.
For hundreds of ETF choices, be sure to reference Thursday’s StatSheet.
For this current domestic “Buy” cycle, here’s how some our candidates have fared:
Click image to enlarge.
Again, the %+/-M/A column above shows the position of the various ETFs in relation to their respective long-term trend lines, while the trailing sell stops are being tracked in the “Off High” column. The “Action” column will signal a “Sell” once the -8% point has been taken out in the “Off High” column. For more volatile sector ETFs, the trigger point is -10%.
3. Trend Tracking Indexes (TTIs)
Our TTIs got clobbered today sending the International one deeper into bear market territory. We will need a little more downside confirmation, before I declare that Buy cycle to be over.
On the Domestic side, we have only a little more to go before a “Sell” signal will be triggered. Given the speed with which these current events have taken place could jeopardize the bullish trend in a hurry.
This is how we closed 11/30/2021:
Domestic TTI: +1.80% above its M/A (prior close +4.57%)—Buy signal effective 07/22/2020.
International TTI: -2.09% below its M/A (prior close -0.81%)—Buy signal effective 07/22/2020.
Disclosure: I am obliged to inform you that I, as well as my advisory clients, own some of the ETFs listed in the above table. Furthermore, they do not represent a specific investment recommendation for you, they merely show which ETFs from the universe I track are falling within the specified guidelines.
All linked charts above are courtesy of Bloomberg via ZeroHedge.
Contact Ulli