
- Moving the markets
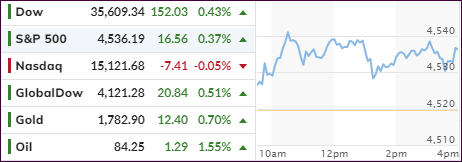
With the bulls continuing their ascent to take out all-time highs, they succeeded by pushing the Dow into record territory, while S&P 500 “only” registered its sixth consecutive day of gains. The Nasdaq lagged by bouncing around its unchanged line while giving up early advances.
MarketWatch was correct with its analysis that the markets have climbed a wall of worries over the past two months. Fears over the delta Covid surge, supply chain hiccups, a China property crisis, the Fed signaling the removal of stimulus and surging inflation, rattled nerves on Wall Street but did not threaten the end of this bullish period.
Combining weaker-than-expected producer prices with better-than-expected bank earnings has so far been a winning combination, but it remains to be seen whether the former can be maintained, or if inflation indeed will rear its ugly head in the future, a view that I share.
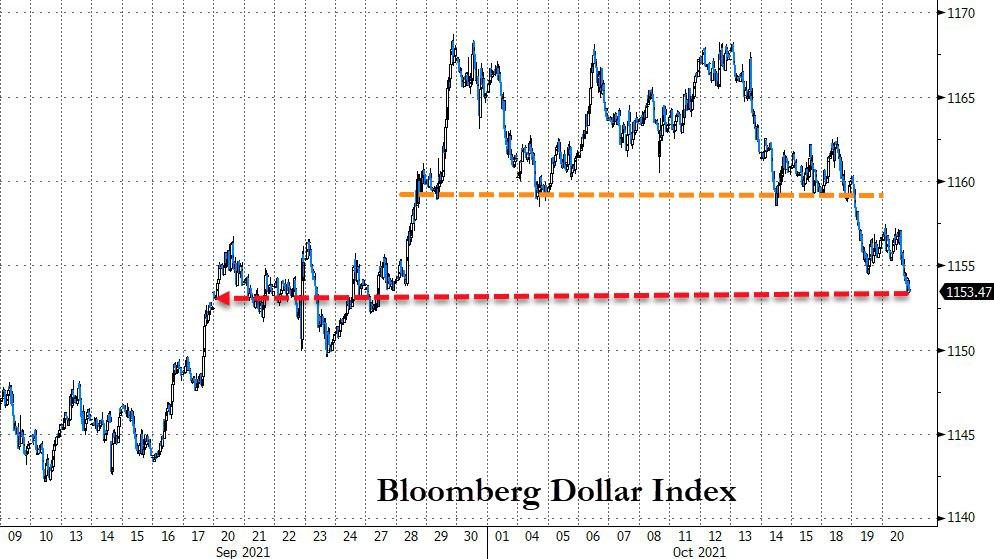
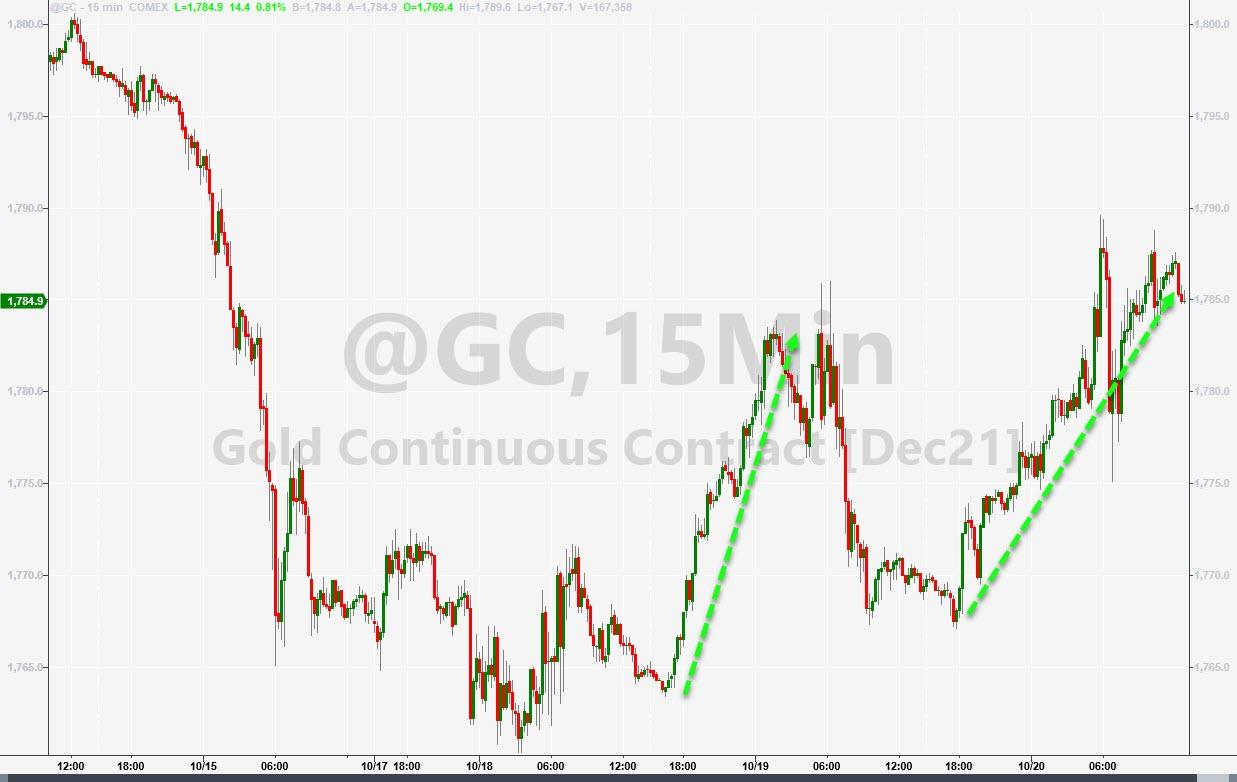
Dumping and jumping played out in different arenas. The US Dollar continued to dump, which Gold took advantage of by jumping 0.75% and again approaching its $1,800 level. Even gently rising bond yields could not take the starch out of gold’s rebound, with the ever-worsening inflationary background lending support to the precious metal.
I’ll be out tomorrow but will post the weekly StatSheet by 6:30 pm PST.
2. ETFs in the Spotlight
In case you missed the announcement and description of this section, you can read it here again.
It features some of the 10 broadly diversified domestic and sector ETFs from my HighVolume list as posted every Saturday. Furthermore, they are screened for the lowest MaxDD% number meaning they have been showing better resistance to temporary sell offs than all others over the past year.
The below table simply demonstrates the magnitude with which these ETFs are fluctuating above or below their respective individual trend lines (%+/-M/A). A break below, represented by a negative number, shows weakness, while a break above, represented by a positive percentage, shows strength.
For hundreds of ETF choices, be sure to reference Thursday’s StatSheet.
For this current domestic “Buy” cycle, here’s how some our candidates have fared:
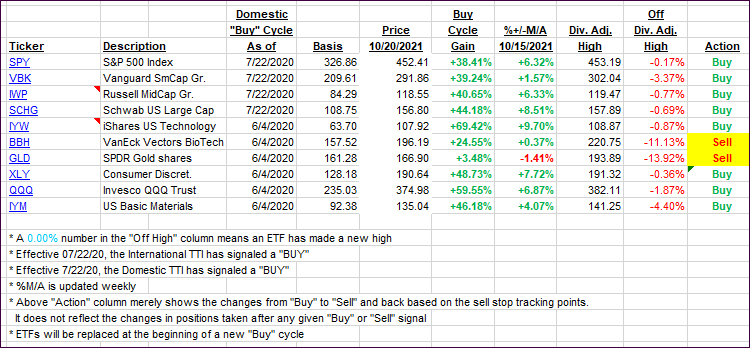
Click image to enlarge.
Again, the %+/-M/A column above shows the position of the various ETFs in relation to their respective long-term trend lines, while the trailing sell stops are being tracked in the “Off High” column. The “Action” column will signal a “Sell” once the -8% point has been taken out in the “Off High” column. For more volatile sector ETFs, the trigger point is -10%.
3. Trend Tracking Indexes (TTIs)
Our TTIs resumed their rebound with the bulls clearly in charge.
This is how we closed 10/20/2021:
Domestic TTI: +7.72% above its M/A (prior close +6.91%)—Buy signal effective 07/22/2020.
International TTI: +4.94% above its M/A (prior close +4.38%)—Buy signal effective 07/22/2020.
Disclosure: I am obliged to inform you that I, as well as my advisory clients, own some of the ETFs listed in the above table. Furthermore, they do not represent a specific investment recommendation for you, they merely show which ETFs from the universe I track are falling within the specified guidelines.
Contact Ulli