
- Moving the markets
Positive earnings reports kept bullish momentum alive, with major companies showing strong report cards, which helped alleviate fears that Covid cases and rising costs might undermine corporate profit margins. So far, this has not happened.
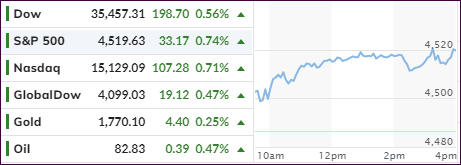
It was “go time” right after the opening bell, and the major indexes followed the path of least resistance, which was up, with all three of them closing solidly in the green. The S&P 500 reclaimed its closely watched 4,500 level without hesitation or skipping a beat, and it is now positioned less than 1% from its all-time high.
Economically speaking, we learned that US Housing Starts and Building Permits plummeted in September, which was preceded by a surprise gain in August. The correction was worse than expected with Building Permits sinking 7.7% MoM vs. an expected drop of 2.4%. Housing Starts tumbled 1.6% vs. no expected change.
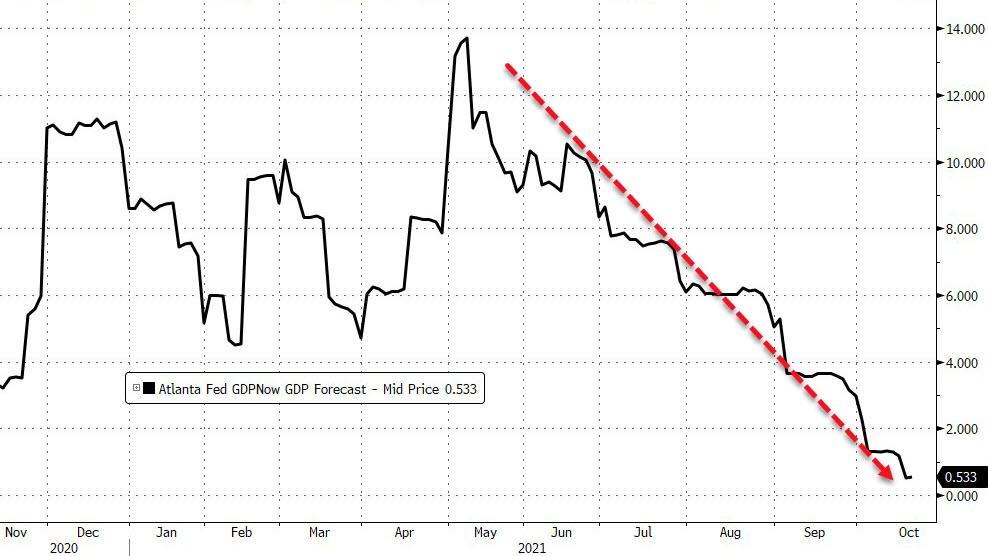
It remains to be seen, if this is an indication of an upcoming broad economic slowdown, because the Atlanta Fed came out today saying the economy teeters on the verge of contraction. Translated, it means growth is falling and inflation is soaring thereby bringing dreaded “S” word, as in Stagflation, back to the front burner.
Added ZeroHedge:
In its latest GDPNow forecast published moments ago, the Atlanta Fed slashed its estimate for real GDP growth in the third quarter of 2021 to just 0.5%, down from 1.2% on October 15, from 6% about two months ago, and down from 14% back in May.
However, looking at market behavior you would not notice any underlying issues, because those concerns are simply overlooked when inconvenient.
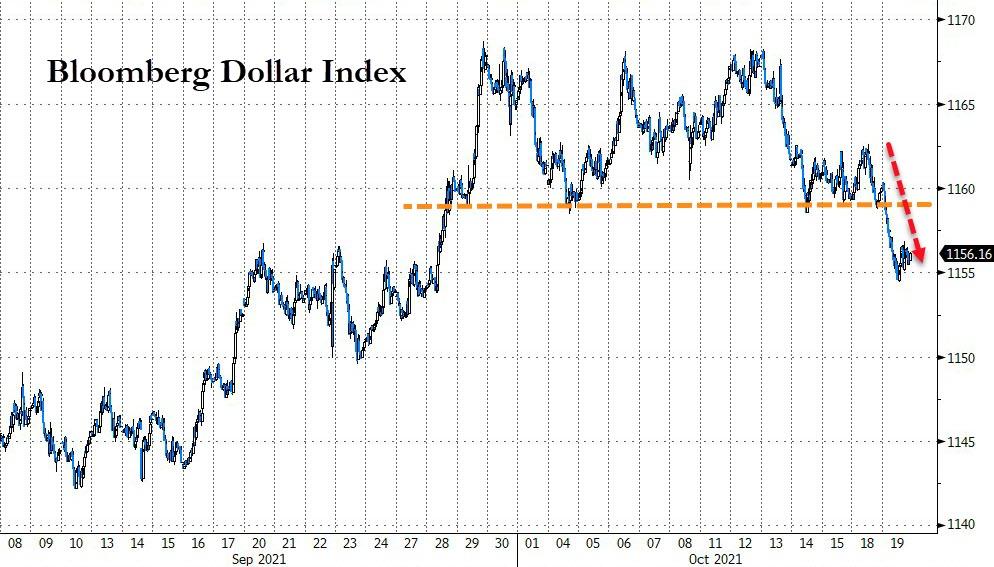
The US Dollar slipped and broke October support to the downside. Bond yields climbed again with the 10-year closing at 1.638%. Gold managed to hang tight and gained slightly, but it was not enough to get over its $1,800 glass ceiling.
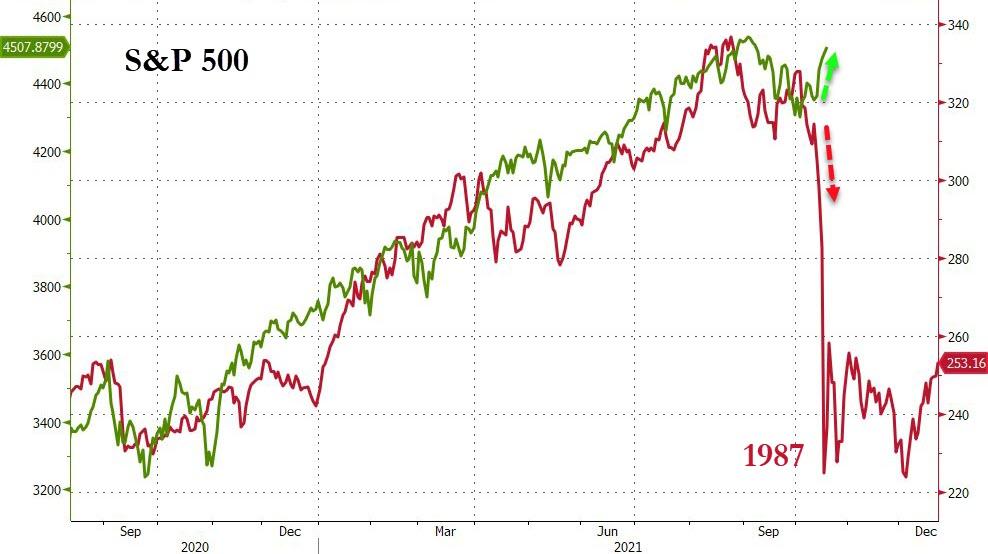
Looking at the comparison chart to 1987, it looks like we may have reached a moment of truth with ZeroHedge quipping “Happy 34th Black Monday Anniversary.”
2. ETFs in the Spotlight
In case you missed the announcement and description of this section, you can read it here again.
It features some of the 10 broadly diversified domestic and sector ETFs from my HighVolume list as posted every Saturday. Furthermore, they are screened for the lowest MaxDD% number meaning they have been showing better resistance to temporary sell offs than all others over the past year.
The below table simply demonstrates the magnitude with which these ETFs are fluctuating above or below their respective individual trend lines (%+/-M/A). A break below, represented by a negative number, shows weakness, while a break above, represented by a positive percentage, shows strength.
For hundreds of ETF choices, be sure to reference Thursday’s StatSheet.
For this current domestic “Buy” cycle, here’s how some our candidates have fared:
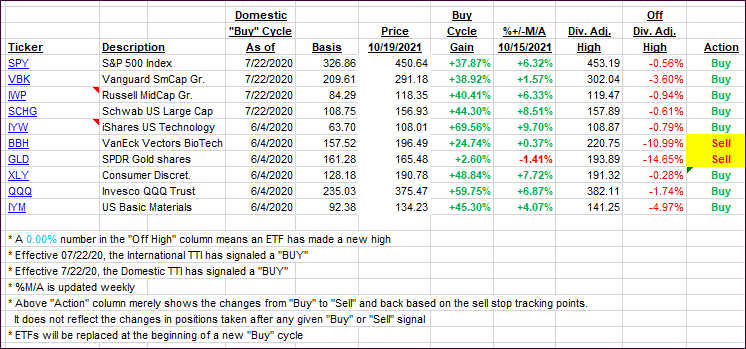
Click image to enlarge.
Again, the %+/-M/A column above shows the position of the various ETFs in relation to their respective long-term trend lines, while the trailing sell stops are being tracked in the “Off High” column. The “Action” column will signal a “Sell” once the -8% point has been taken out in the “Off High” column. For more volatile sector ETFs, the trigger point is -10%.
3. Trend Tracking Indexes (TTIs)
Our TTIs ramped with the markets and closed solidly higher.
This is how we closed 10/19/2021:
Domestic TTI: +6.91% above its M/A (prior close +6.28%)—Buy signal effective 07/22/2020.
International TTI: +4.38% above its M/A (prior close +3.90%)—Buy signal effective 07/22/2020.
Disclosure: I am obliged to inform you that I, as well as my advisory clients, own some of the ETFs listed in the above table. Furthermore, they do not represent a specific investment recommendation for you, they merely show which ETFs from the universe I track are falling within the specified guidelines.
Contact Ulli