
- Moving the markets
It had to happen eventually, and today was the day when Atlanta Fed President Bostic finally broke away from the common theme, and confirmed what I have been saying all year:
Price surges caused by supply-chain disruptions, or the reopening of the services sector are likely to last, i.e., they are not transitory, and seem to be broadening to more parts of the economy, i.e., getting worse.
In other words, inflation will be with us and will not be of a transitory nature. While other Fed officials are singing a different tune, I would not be surprised if they adopt this type of narrative—eventually.
The markets continued to be affected by volatility, and the result was sloppy and choppy trading, with dip buyers finding no reason to step in and clean up this mess. With a key inflation reading (CPI) ahead of us, as well as retails sales numbers, and the earnings season on deck, the major indexes slid for the third straight session.
Adding to this uncertainty is Wednesday’s release of the minutes from September’s FOMC meeting, which will be dissected for any clues about the Central Bank’s plans to reduce easy monetary policy.
Headwinds abound, and traders are looking for directional guidance wherever they can find it, with slower economic growth ahead being a major threat.
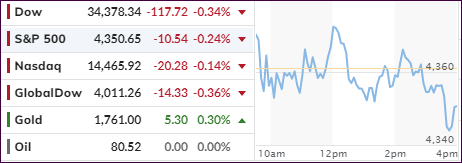
During this session, the US Dollar ended up a tad, as 10-year bond yields slipped to 1.573%, which allowed Gold to edge higher by a moderate 0.32%. While this day was volatile, it was quiet with tight trading ranges prevailing across the indexes, but this will likely change given the variety of upcoming events.
2. ETFs in the Spotlight
In case you missed the announcement and description of this section, you can read it here again.
It features some of the 10 broadly diversified domestic and sector ETFs from my HighVolume list as posted every Saturday. Furthermore, they are screened for the lowest MaxDD% number meaning they have been showing better resistance to temporary sell offs than all others over the past year.
The below table simply demonstrates the magnitude with which these ETFs are fluctuating above or below their respective individual trend lines (%+/-M/A). A break below, represented by a negative number, shows weakness, while a break above, represented by a positive percentage, shows strength.
For hundreds of ETF choices, be sure to reference Thursday’s StatSheet.
For this current domestic “Buy” cycle, here’s how some our candidates have fared:
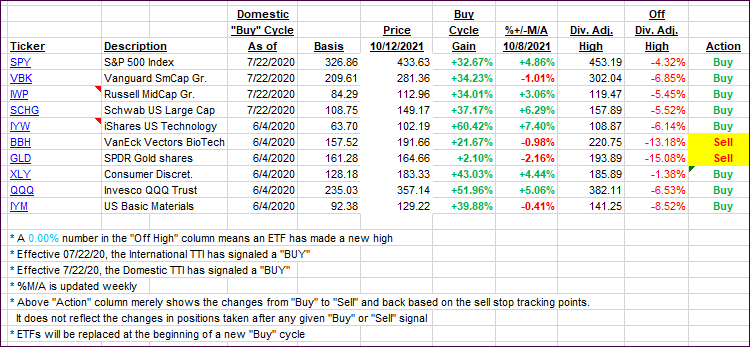
Click image to enlarge.
Again, the %+/-M/A column above shows the position of the various ETFs in relation to their respective long-term trend lines, while the trailing sell stops are being tracked in the “Off High” column. The “Action” column will signal a “Sell” once the -8% point has been taken out in the “Off High” column. For more volatile sector ETFs, the trigger point is -10%.
3. Trend Tracking Indexes (TTIs)
Our TTIs changed only inconsequentially.
This is how we closed 10/12/2021:
Domestic TTI: +4.39% above its M/A (prior close +4.37%)—Buy signal effective 07/22/2020.
International TTI: +2.37% above its M/A (prior close +2.75%)—Buy signal effective 07/22/2020.
Disclosure: I am obliged to inform you that I, as well as my advisory clients, own some of the ETFs listed in the above table. Furthermore, they do not represent a specific investment recommendation for you, they merely show which ETFs from the universe I track are falling within the specified guidelines.
All linked charts above are courtesy of Bloomberg via ZeroHedge.
Contact Ulli