
- Moving the markets
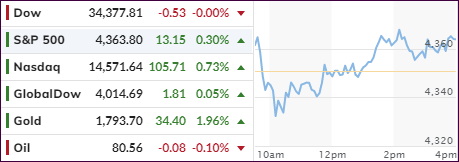
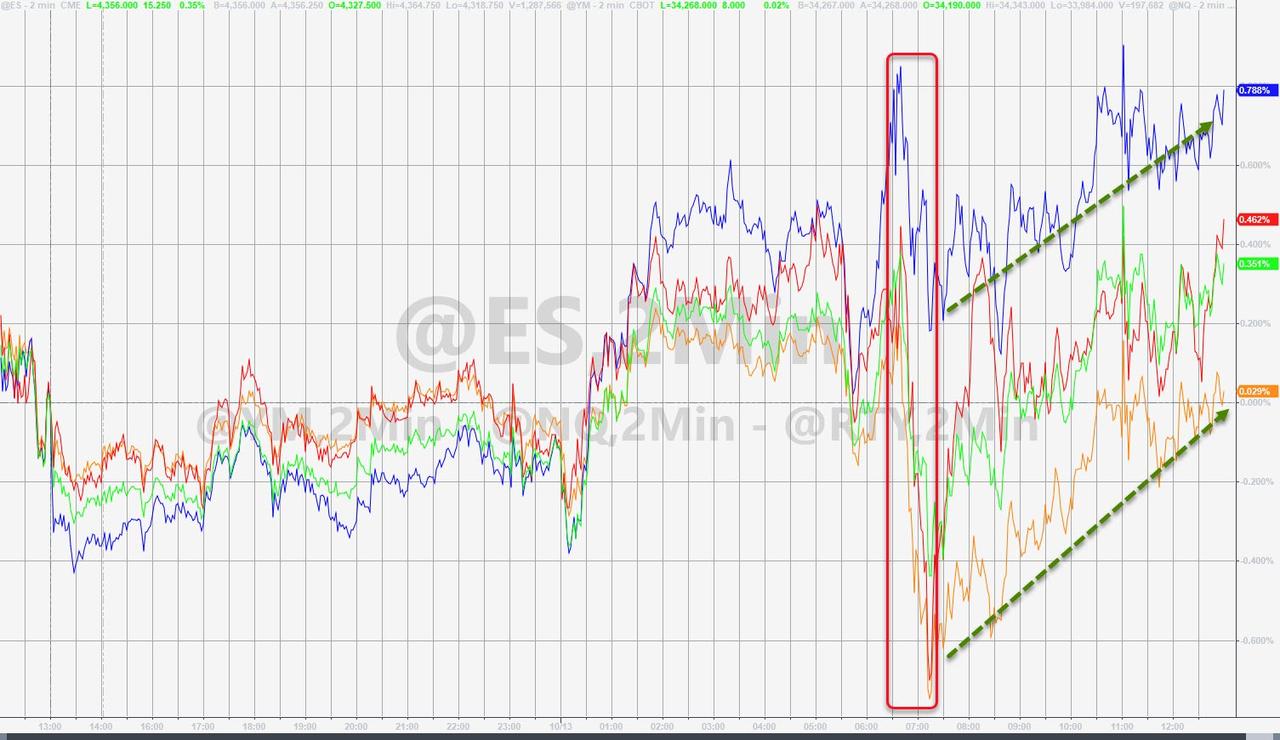
Two of the three major indexes found themselves in an early hole, but late session bullishness reversed the initial trend and assured a steady upward climb. The Dow reached its unchanged line, the S&P 500 ended up with moderate gains, but the Nasdaq bounced in the green all day and produced a solid advance of 0.73%.
The 3-day losing streak is now in the rearview mirror with some support coming from the widely analyzed FOMC report, which showed that the Central Bank could begin tapering its asset-purchase program as soon as by the middle of November:
Participants generally assessed that, provided that the economic recovery remained broadly on track, a gradual tapering process that concluded around the middle of next year would likely be appropriate,” the minutes said.
No surprises there, so traders focused on the CPI numbers. The index jumped 0.4% in September from the prior month and 5.4% year over year vs. expectations of 0.3% or an annualized rate of 5.3%. Of course, one analyst could not help himself by stating that most of these inflationary pressures are transitory. Yeah right.
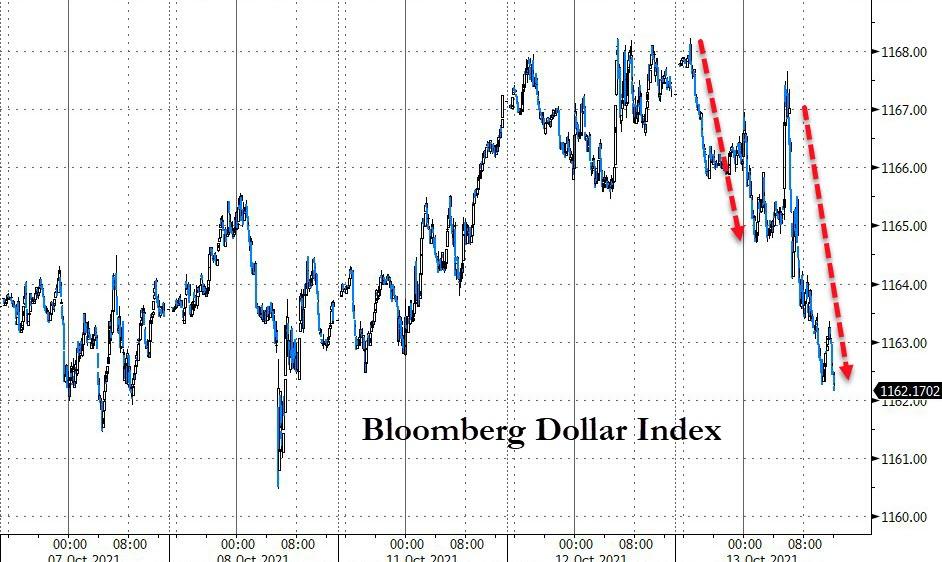
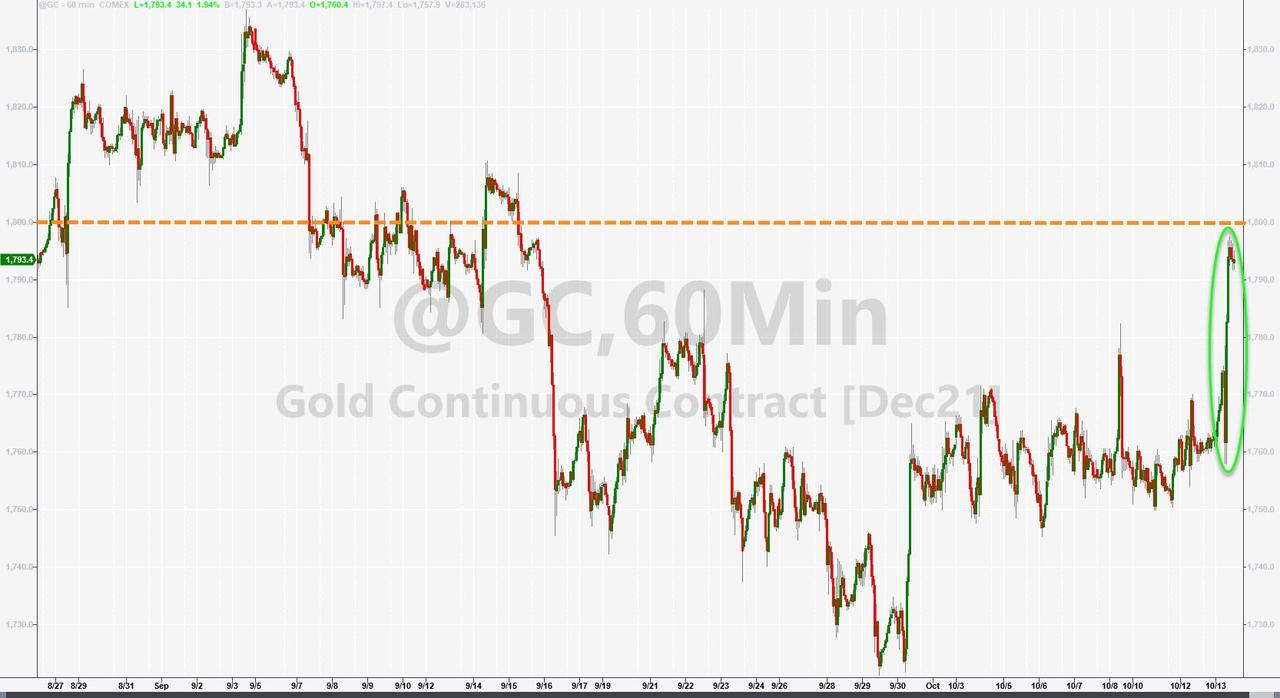
The US Dollar dipped and ripped and then lost all momentum and closed down -0.51%, joined by 10-year bond yields, which also showed weakness. This combination, coupled with continued uncertainty, proved to be a boon for gold with the precious metal roaring towards its $1,800 level and gaining almost 2%.
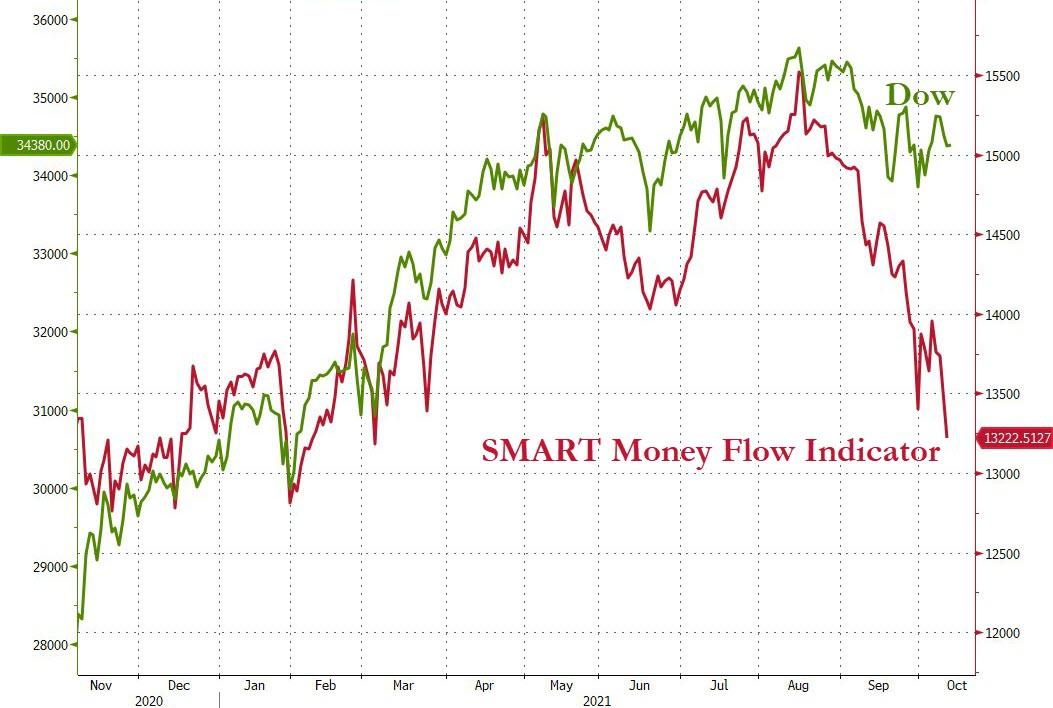
Despite the rebound supported by dip buyers, there is one segment of the markets that still does not participate, as Bloomberg shows in this chart. Makes me wonder why…
2. ETFs in the Spotlight
In case you missed the announcement and description of this section, you can read it here again.
It features some of the 10 broadly diversified domestic and sector ETFs from my HighVolume list as posted every Saturday. Furthermore, they are screened for the lowest MaxDD% number meaning they have been showing better resistance to temporary sell offs than all others over the past year.
The below table simply demonstrates the magnitude with which these ETFs are fluctuating above or below their respective individual trend lines (%+/-M/A). A break below, represented by a negative number, shows weakness, while a break above, represented by a positive percentage, shows strength.
For hundreds of ETF choices, be sure to reference Thursday’s StatSheet.
For this current domestic “Buy” cycle, here’s how some our candidates have fared:
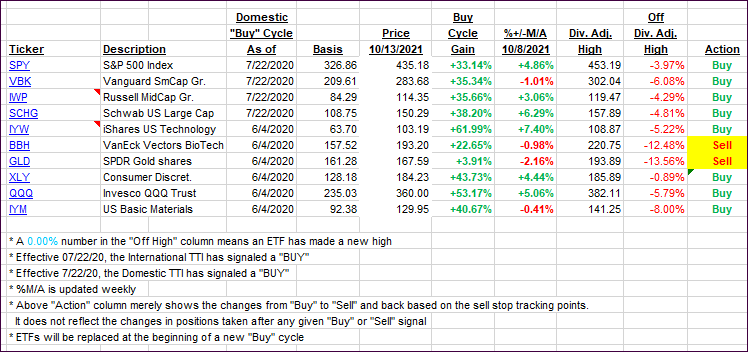
Click image to enlarge.
Again, the %+/-M/A column above shows the position of the various ETFs in relation to their respective long-term trend lines, while the trailing sell stops are being tracked in the “Off High” column. The “Action” column will signal a “Sell” once the -8% point has been taken out in the “Off High” column. For more volatile sector ETFs, the trigger point is -10%.
3. Trend Tracking Indexes (TTIs)
Our TTIs both inched higher as the comeback rally was broadbased.
This is how we closed 10/13/2021:
Domestic TTI: +4.57% above its M/A (prior close +4.39%)—Buy signal effective 07/22/2020.
International TTI: +2.56% above its M/A (prior close +2.37%)—Buy signal effective 07/22/2020.
Disclosure: I am obliged to inform you that I, as well as my advisory clients, own some of the ETFs listed in the above table. Furthermore, they do not represent a specific investment recommendation for you, they merely show which ETFs from the universe I track are falling within the specified guidelines.
All linked charts above are courtesy of Bloomberg via ZeroHedge.
Contact Ulli