
- Moving the markets
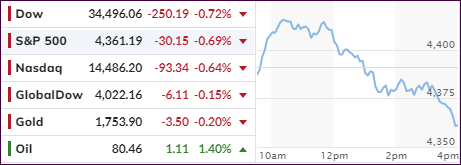
An early broad rally bit the dust, with the major indexes losing all initial gains and not just sliding into the red but also closing at the lows of the session.
While the bond market was closed in the US, the Chinese probably wish theirs would have been too, but no such luck. They were fully open, and traders took advantage of it by focusing on one thing only, namely selling.
ZeroHedge called it this way:
In the aftermath of our viral post “”Catastrophic” Property Sales Mean China’s Worst-Case Scenario Is Now In Play”, China property firms bonds were hit with another wrecking ball on Monday as Evergrande was set to miss its third round of (offshore) bond payments in as many weeks and rival Modern Land became the latest scrambling to delay deadlines.
And then this:
“It’s a disastrous day,” Clarence Tam, fixed income PM at Avenue Asset Management in Hong Kong, told Reuters, highlighting how even some supposedly safer “investment grade” firms had now seen 20% wiped off their bonds. “We think it’s driven by global fund outflow….
As I mentioned before when the Evergrande story broke a weeks ago “there is never just one cockroach,” a theory that has proven correct with a host of other Chinese developers trying to find a way to avoid the unavoidable.
Adding to that uncertainty from the usual suspects like surging oil prices, ever increasing inflation, economic concerns with the impending third quarter earnings season on deck, and it came as no surprise that the markets shifted into retreat mode.
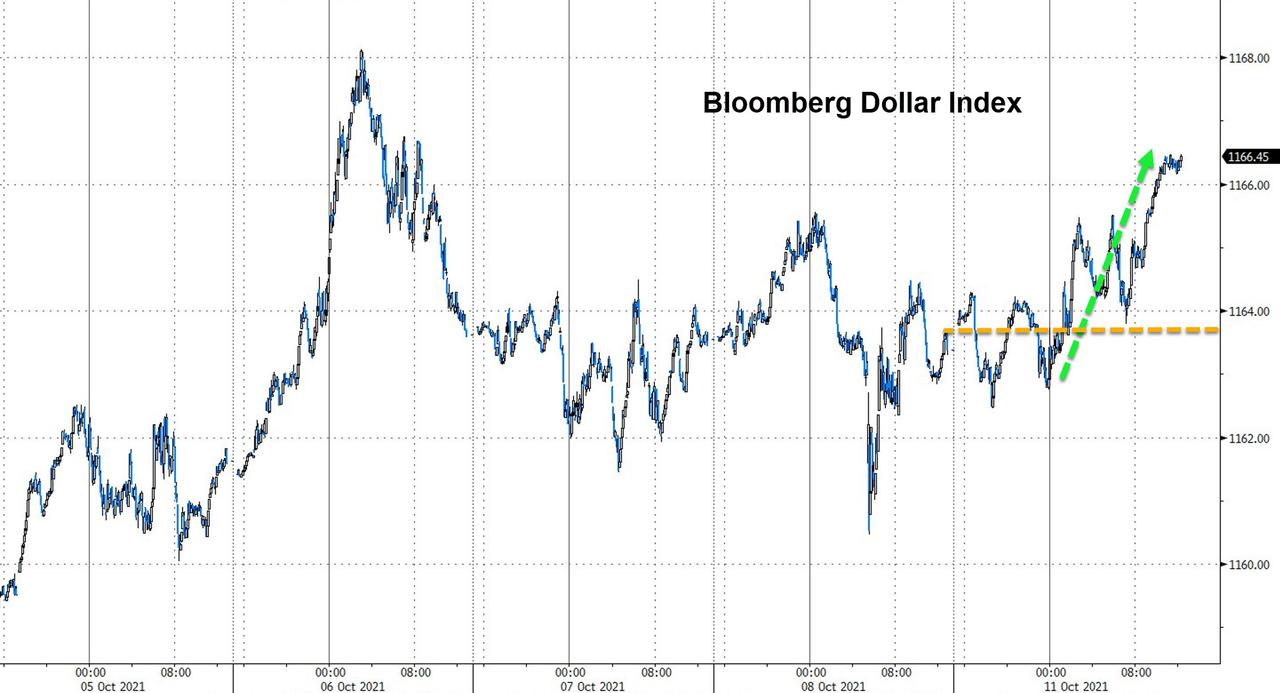
While at first rangebound, the US Dollar broke out to the upside and closed higher causing gold to pretty much tread water and go nowhere.
In the end, it seemed that traders and computer algos alike tried to grapple with these various events. As it turned out, at least for this session, the path of least resistance was to the downside.
2. ETFs in the Spotlight
In case you missed the announcement and description of this section, you can read it here again.
It features some of the 10 broadly diversified domestic and sector ETFs from my HighVolume list as posted every Saturday. Furthermore, they are screened for the lowest MaxDD% number meaning they have been showing better resistance to temporary sell offs than all others over the past year.
The below table simply demonstrates the magnitude with which these ETFs are fluctuating above or below their respective individual trend lines (%+/-M/A). A break below, represented by a negative number, shows weakness, while a break above, represented by a positive percentage, shows strength.
For hundreds of ETF choices, be sure to reference Thursday’s StatSheet.
For this current domestic “Buy” cycle, here’s how some our candidates have fared:
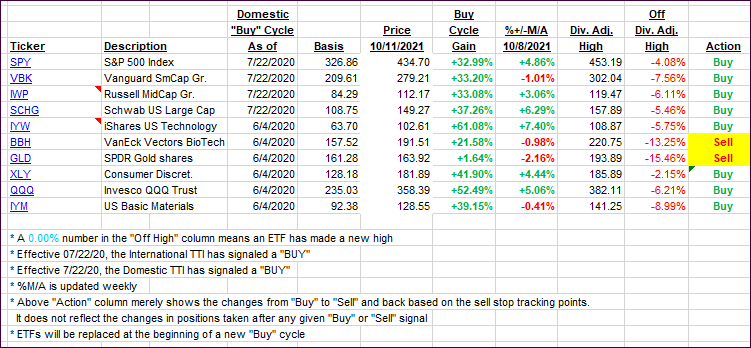
Click image to enlarge.
Again, the %+/-M/A column above shows the position of the various ETFs in relation to their respective long-term trend lines, while the trailing sell stops are being tracked in the “Off High” column. The “Action” column will signal a “Sell” once the -8% point has been taken out in the “Off High” column. For more volatile sector ETFs, the trigger point is -10%.
3. Trend Tracking Indexes (TTIs)
Our TTIs slipped with the markets diving after an early rally.
This is how we closed 10/11/2021:
Domestic TTI: +4.37% above its M/A (prior close +4.94%)—Buy signal effective 07/22/2020.
International TTI: +2.75% above its M/A (prior close +2.86%)—Buy signal effective 07/22/2020.
Disclosure: I am obliged to inform you that I, as well as my advisory clients, own some of the ETFs listed in the above table. Furthermore, they do not represent a specific investment recommendation for you, they merely show which ETFs from the universe I track are falling within the specified guidelines.
All linked charts above are courtesy of Bloomberg via ZeroHedge.
Contact Ulli