
- Moving the markets
The continuing crisis in China with their worsening Evergrande developer spectacle and potential default in the hundreds of billions of dollars, was simply moved to back burner, at least for this session.
However, this fact remains:
But the elephant in the room is not the write down of a modest $18 billion in foreign bonds to the likes of Blackrock, for whom this is peanuts. The real question is how an Evergrande failure would impact confidence in China’s property sector and whether it will lead to a sharp drop in what has traditionally been the world’s most valuable asset, one which represents some 70% of China’s urban household net worth.
For sure, we have not heard the last of this predicament…
Dominating the markets was the Fed and its indication that current monetary stimulus would continue just a while longer, with the powers to be not yet having announced a formal starting date.
The central bank issued a statement following the meeting that said if progress continues “as expected,” then a “moderation in the pace of asset purchases may soon be warranted.”
That was sufficient encouragement, and equities shifted into overdrive with the three major indexes adding over 1% each. To no surprise, this ramp-a-thon was enough to wipe out the losses sustained on Monday and Tuesday and push the indexes back into the green for the week.
I took the opportunity to replace our recently sold value ETF with a more appropriate holding for the current environment.
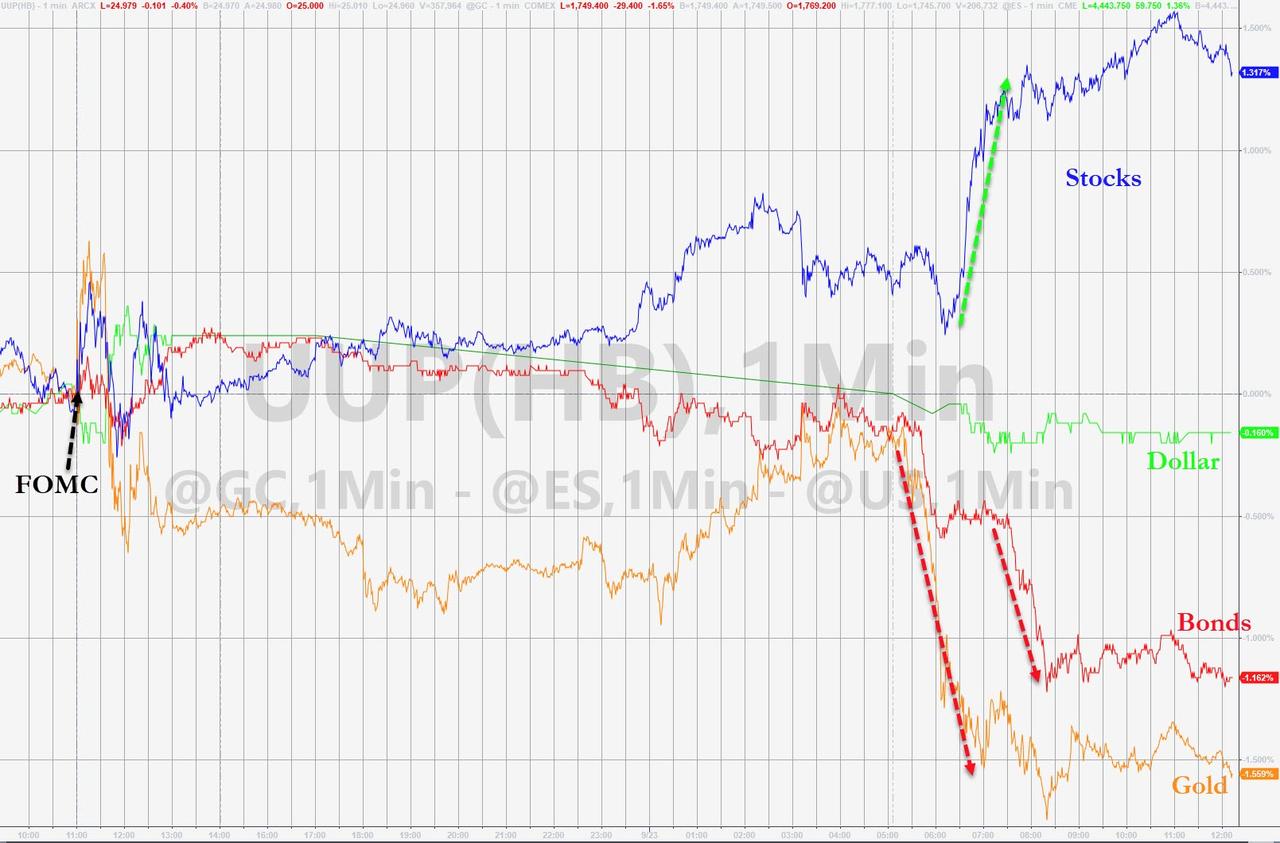
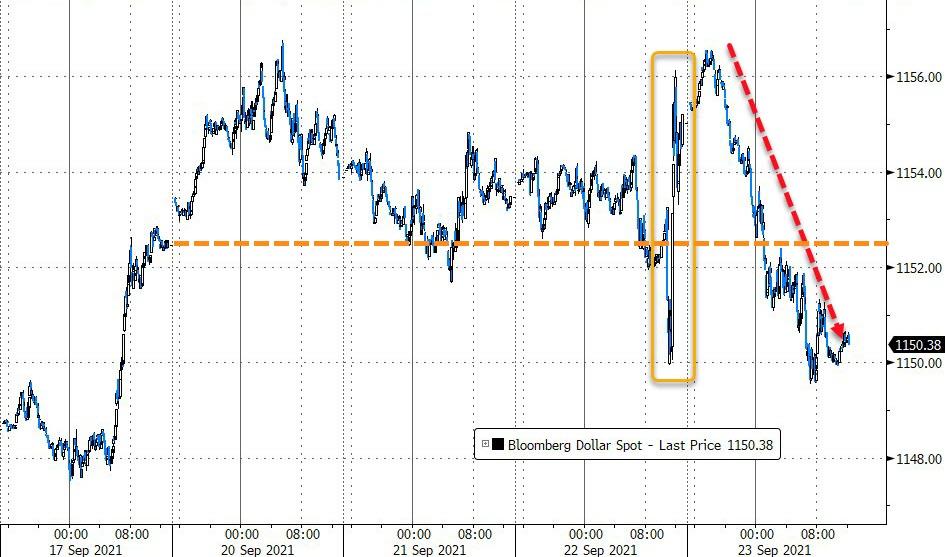
It was a tale two markets with stocks up and everything else down. Another big assist came from a short squeeze, which helped to pull the indexes out of their doldrums. The US Dollar gagged and surrendered yesterday’s gains.
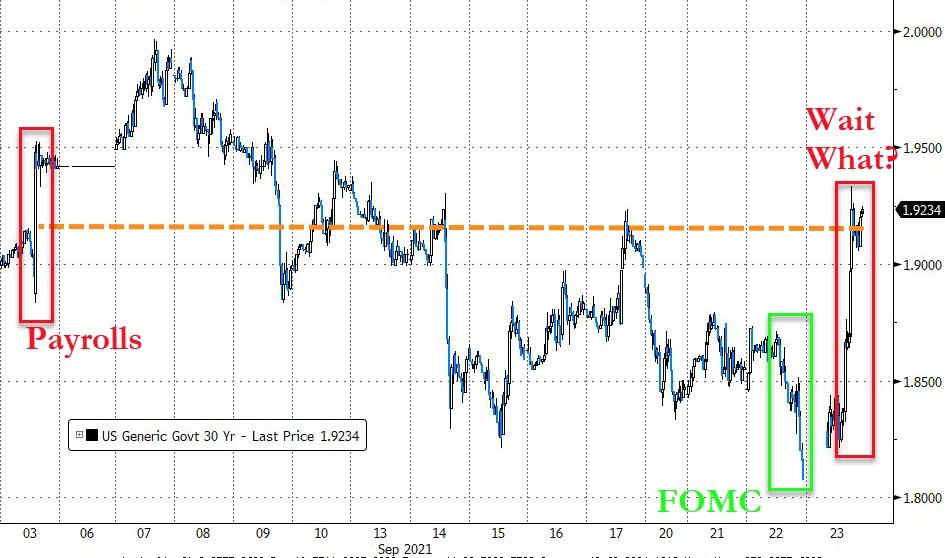
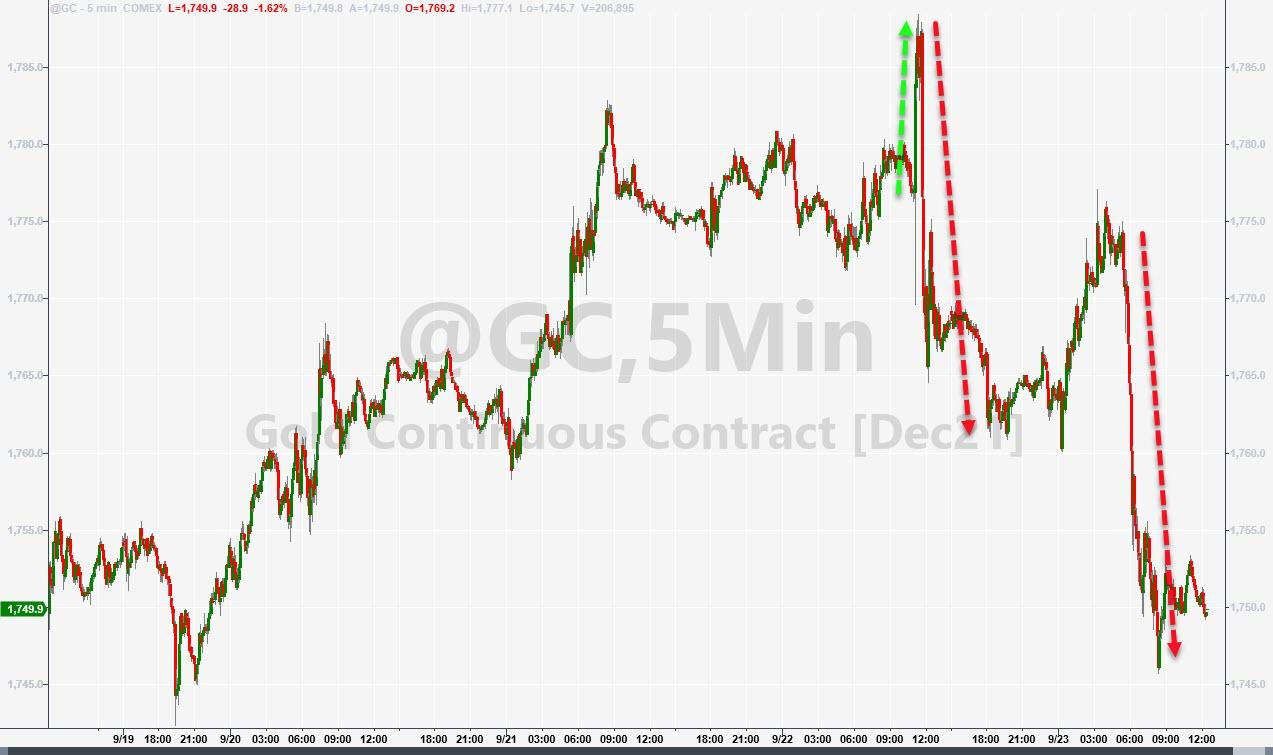
Bond yields surged and gold got purged, as even a diving dollar could not prevent the precious metal price from being shaken up.
As a reminder, I will be out again tomorrow, so there will be no market commentary, but I will post the weekly StatSheet by 6:30 pm PST tonight.
2. ETFs in the Spotlight
In case you missed the announcement and description of this section, you can read it here again.
It features some of the 10 broadly diversified domestic and sector ETFs from my HighVolume list as posted every Saturday. Furthermore, they are screened for the lowest MaxDD% number meaning they have been showing better resistance to temporary sell offs than all others over the past year.
The below table simply demonstrates the magnitude with which these ETFs are fluctuating above or below their respective individual trend lines (%+/-M/A). A break below, represented by a negative number, shows weakness, while a break above, represented by a positive percentage, shows strength.
For hundreds of ETF choices, be sure to reference Thursday’s StatSheet.
For this current domestic “Buy” cycle, here’s how some our candidates have fared:
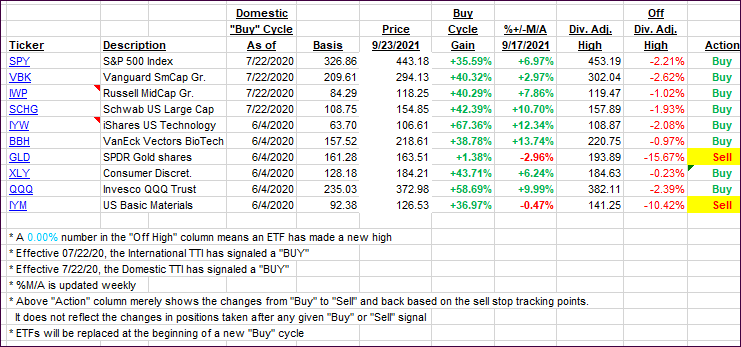
Click image to enlarge.
Again, the %+/-M/A column above shows the position of the various ETFs in relation to their respective long-term trend lines, while the trailing sell stops are being tracked in the “Off High” column. The “Action” column will signal a “Sell” once the -8% point has been taken out in the “Off High” column. For more volatile sector ETFs, the trigger point is -10%.
3. Trend Tracking Indexes (TTIs)
Our TTIs joined the ramp-a-thon and rallied.
This is how we closed 09/23/2021:
Domestic TTI: +6.32% above its M/A (prior close +4.78%)—Buy signal effective 07/22/2020.
International TTI: +3.48% above its M/A (prior close +2.19%)—Buy signals effective 07/22/2020.
Disclosure: I am obliged to inform you that I, as well as my advisory clients, own some of the ETFs listed in the above table. Furthermore, they do not represent a specific investment recommendation for you, they merely show which ETFs from the universe I track are falling within the specified guidelines. All linked charts above are courtesy of Bloomberg via ZeroHedge.
Contact Ulli