
- Moving the markets
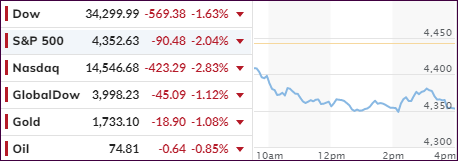
There was no question that spiking bond yields were the destroyer of equity prices, with the major indexes tanking in unison right after the opening bell. A couple of rebound attempts were rebuffed, and the downward trend continued with the Nasdaq faring the worst with a loss of 2.83%.
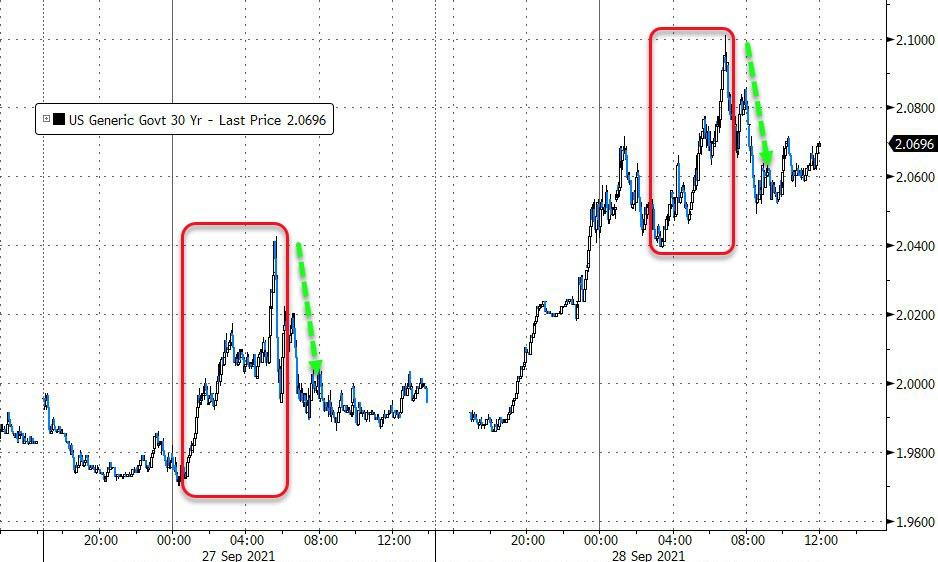
Bond yields shot up with the 10-year touching 1.558%, its highest level since June, before retreating, while the 30-year catapulted above 2%. Amazingly, we saw the 10-year as low as 1.29% last week, and it had sunk as low as 1.13% in August. These are huge moves in that arena, which handed bond investors severe losses.
The reason for surging yields is increased conviction by traders that that the Fed will no longer talk but start tapering its $120 billion in monthly bond purchases “real soon.” What that means is that artificially suppressed rates due to tapering will now have to face the reality of a “true” market.
Added strategist Kathy Jones:
The market’s been steadily coming around to the reality that yields were awfully low relative to the fundamentals. Now the Fed is shifting, and everybody’s shifting their positions, all at once, as we tend to do.
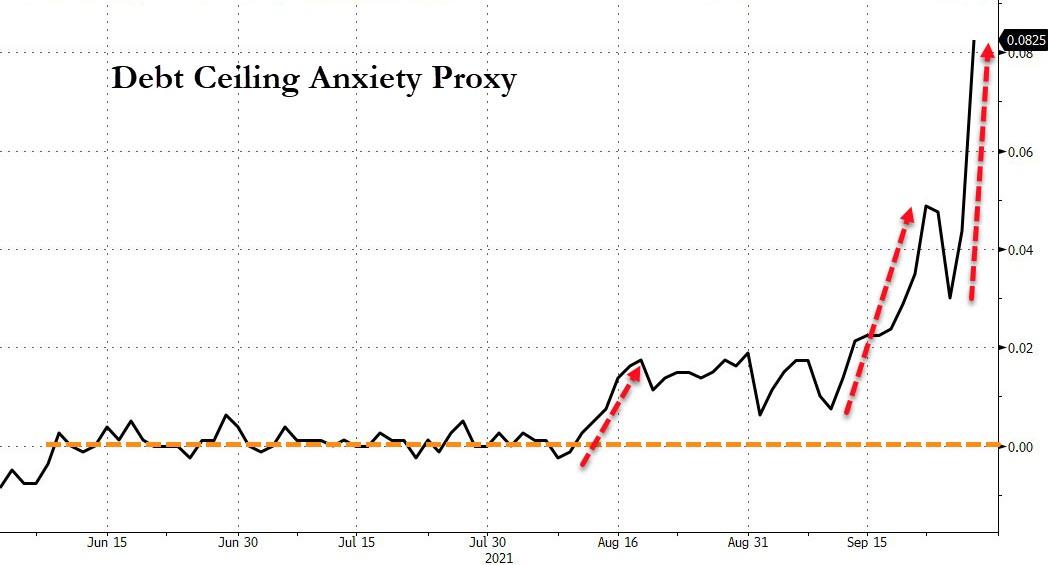
Not helping matters was the ongoing budget showdown and the debt ceiling debacle, neither one of which exerted any positives towards the market. Uncertainty will keep a lid on any attempts to push equities higher.
Technical damage was done to the indexes, as Zero Hedge pointed out:
- S&P broke back below 50DMA, testing 100DMA
- Nasdaq broke back below 50DMA, testing 100DMA
- Dow broke back below 50DMA and 100DMA
- Russell 2000 broke back below 50DMA
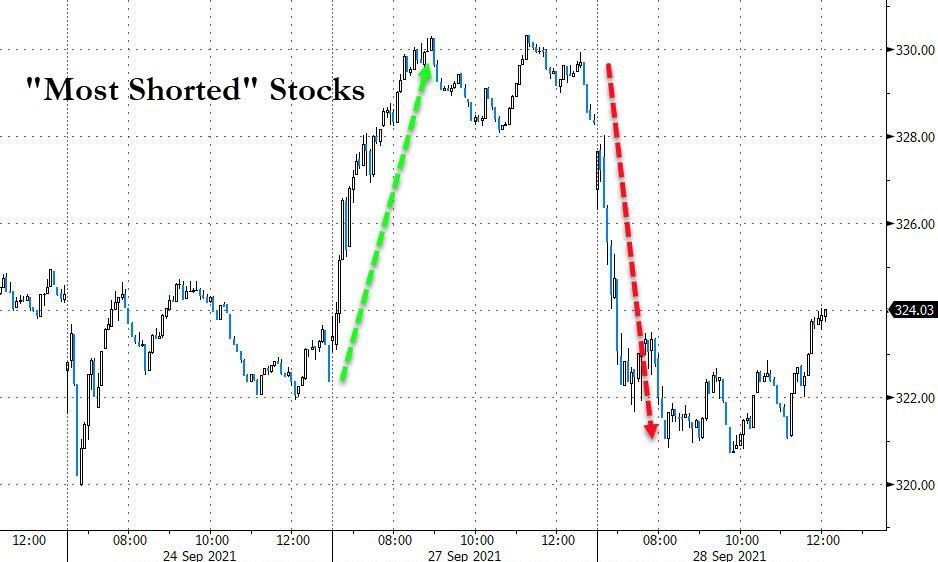
When appropriate, I mention short squeezes and how they are supporting the bullish meme. However, none of that was present today, as “the most shorted stocks” did what they are supposed to, namely head south, and consequently wiped out yesterday’s squeeze gains in the process.
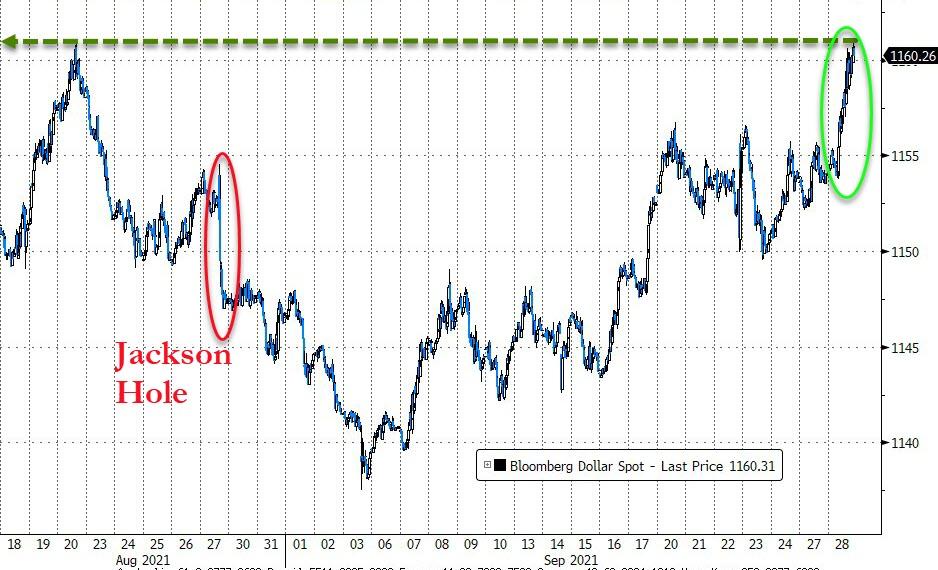
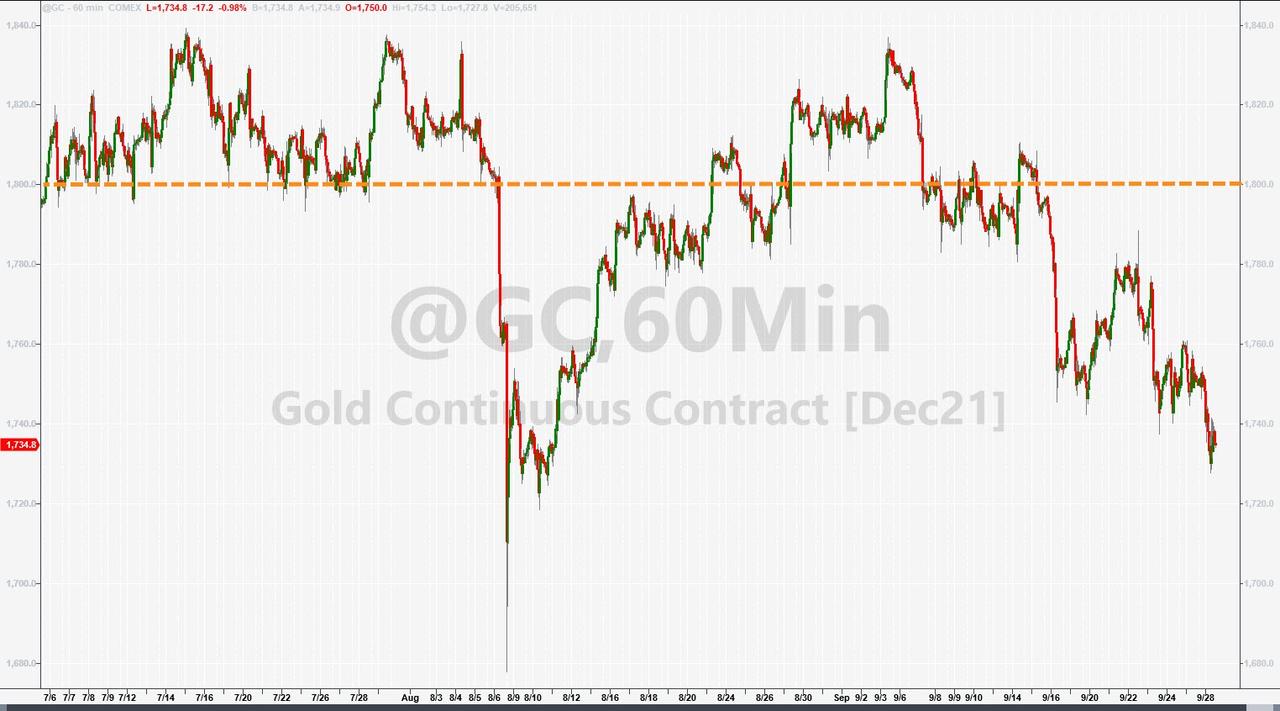
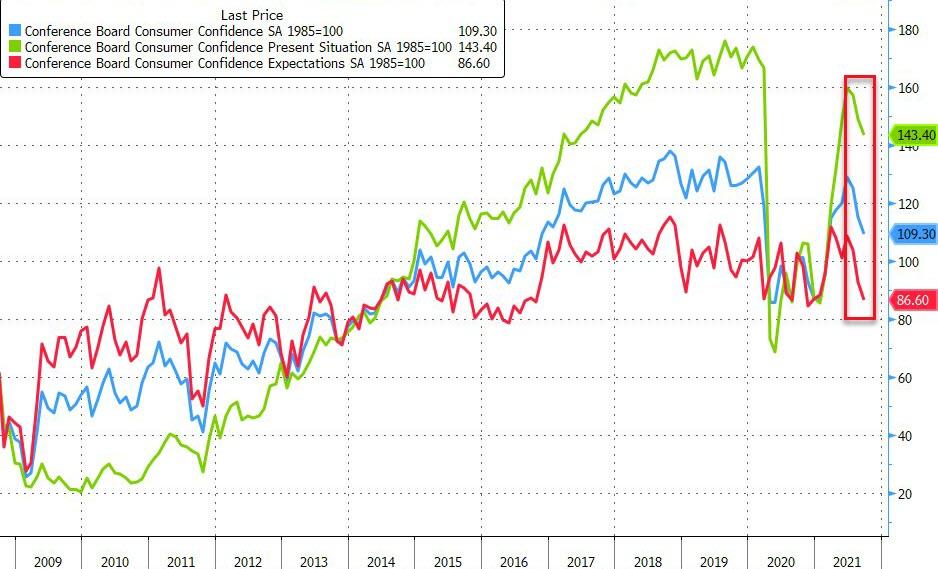
The US Dollar likes rising bond yields and continued its melt up and, during this course of action, slammed gold by over 1%. On the economic side, US Consumer Confidence plunged to 7-month lows, thus enhancing the sour mood on Wall Street.
You can see my latest blogging schedule here.
2. ETFs in the Spotlight
In case you missed the announcement and description of this section, you can read it here again.
It features some of the 10 broadly diversified domestic and sector ETFs from my HighVolume list as posted every Saturday. Furthermore, they are screened for the lowest MaxDD% number meaning they have been showing better resistance to temporary sell offs than all others over the past year.
The below table simply demonstrates the magnitude with which these ETFs are fluctuating above or below their respective individual trend lines (%+/-M/A). A break below, represented by a negative number, shows weakness, while a break above, represented by a positive percentage, shows strength.
For hundreds of ETF choices, be sure to reference Thursday’s StatSheet.
For this current domestic “Buy” cycle, here’s how some our candidates have fared:

Click image to enlarge.
Again, the %+/-M/A column above shows the position of the various ETFs in relation to their respective long-term trend lines, while the trailing sell stops are being tracked in the “Off High” column. The “Action” column will signal a “Sell” once the -8% point has been taken out in the “Off High” column. For more volatile sector ETFs, the trigger point is -10%.
3. Trend Tracking Indexes (TTIs)
Our TTIs got spanked when surging bond yields slammed equities.
This is how we closed 09/28/2021:
Domestic TTI: +5.10% above its M/A (prior close +6.69%)—Buy signal effective 07/22/2020.
International TTI: +2.74% above its M/A (prior close +3.90%)—Buy signals effective 07/22/2020.
Disclosure: I am obliged to inform you that I, as well as my advisory clients, own some of the ETFs listed in the above table. Furthermore, they do not represent a specific investment recommendation for you, they merely show which ETFs from the universe I track are falling within the specified guidelines.
All linked charts above are courtesy of Bloomberg via ZeroHedge.
Contact Ulli