
- Moving the markets
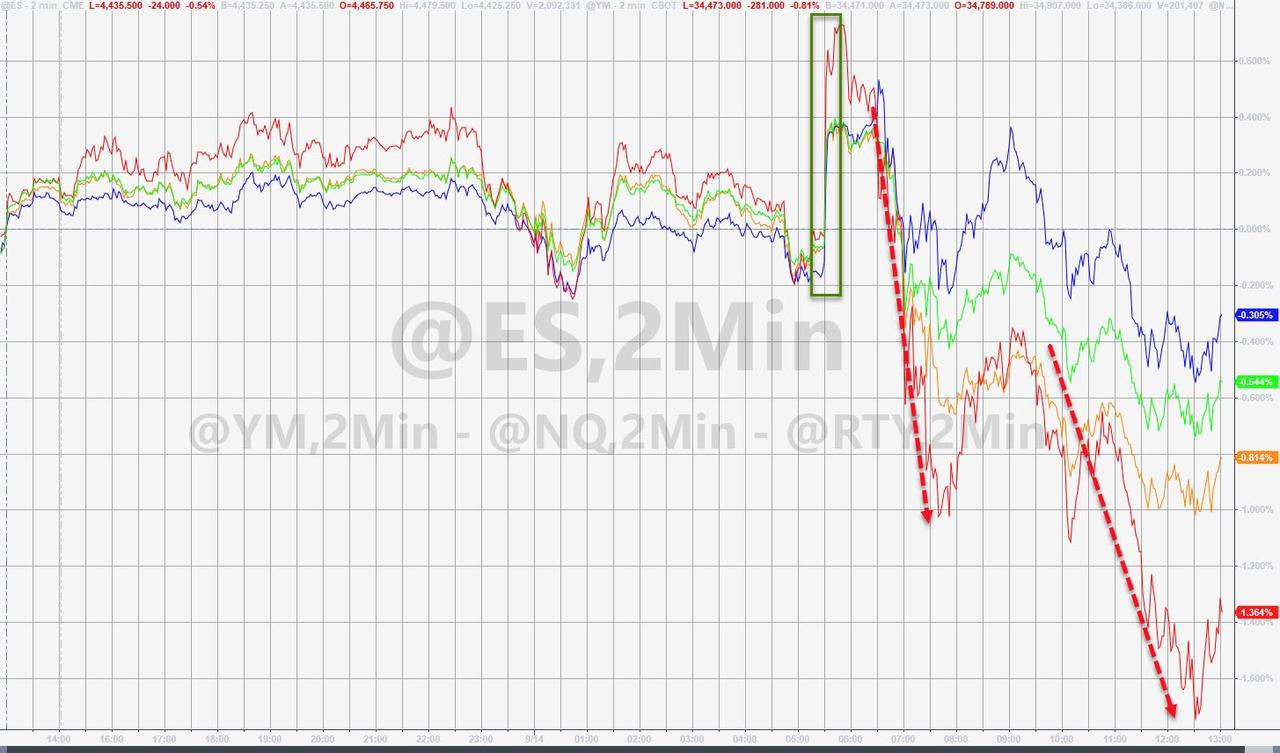
Except for yesterday, we have seen the pattern of an early bump getting pounded in the afternoon during all last week. While Monday instilled some confidence in traders’ minds that the bullish meme is still alive, that mantra was smashed today with the major indexes spending most of the session below their respective unchanged lines.
Even a better-than-expected inflation report could not stop the bears from taking over and sending the indexes to another red close. Despite the downward trend during 6 out of the last 7 sessions, the losses were moderate and certainly not out of line given the relentless march higher during this year.
The CPI came in slightly below expectations at 0.3% MoM vs. 0.4% MoM expected and printed at 5.3% YoY, which was in line with forecasts. Still, this is a significant jump, despite one analyst calling it “continued easing in the inflation piece without deterioration in the economic outlook.” We’ll revisit that wishful thought next month.
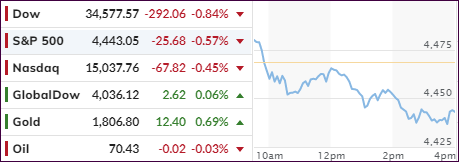
There was no place to hide, as “red” was the dominant color of the session, with the Dow and Small Caps having their worst day since mid-July, as ZeroHedge posted, but “value,” as represented by RPG, had its own issues by giving back just about all of yesterday’s gains.
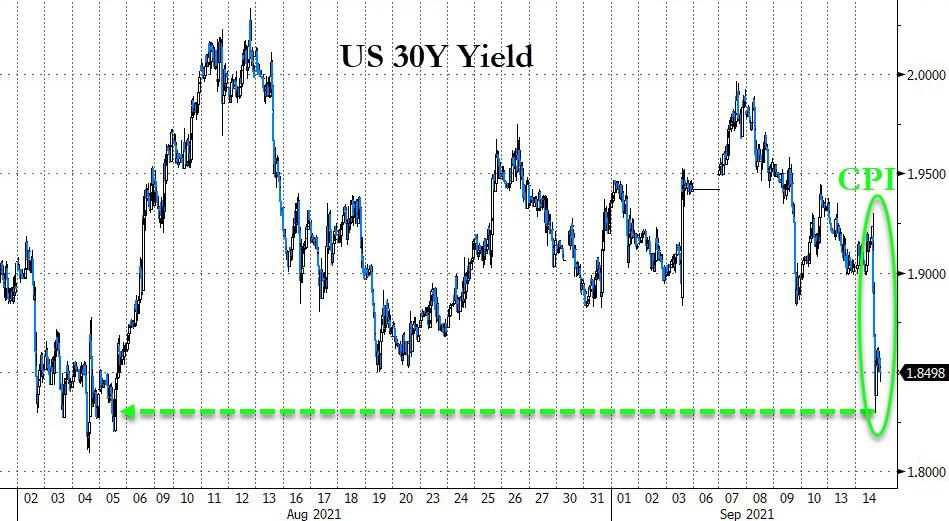
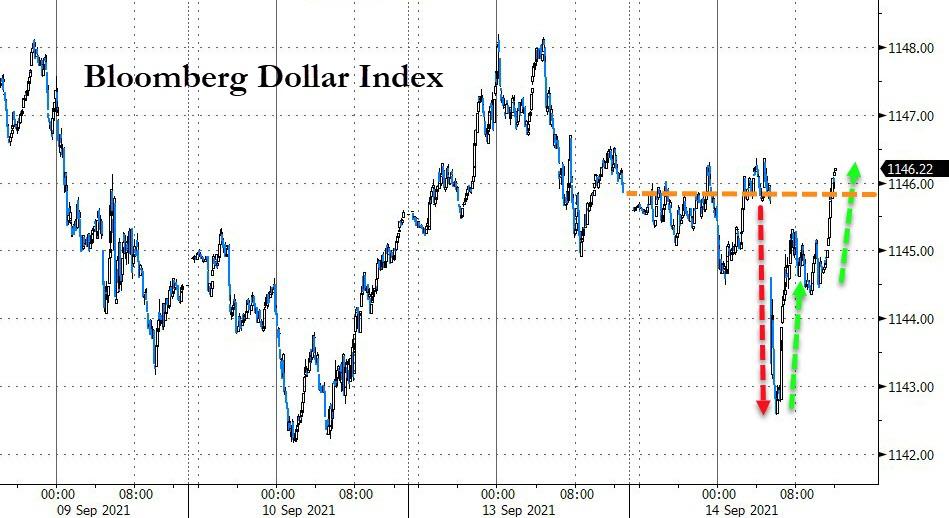
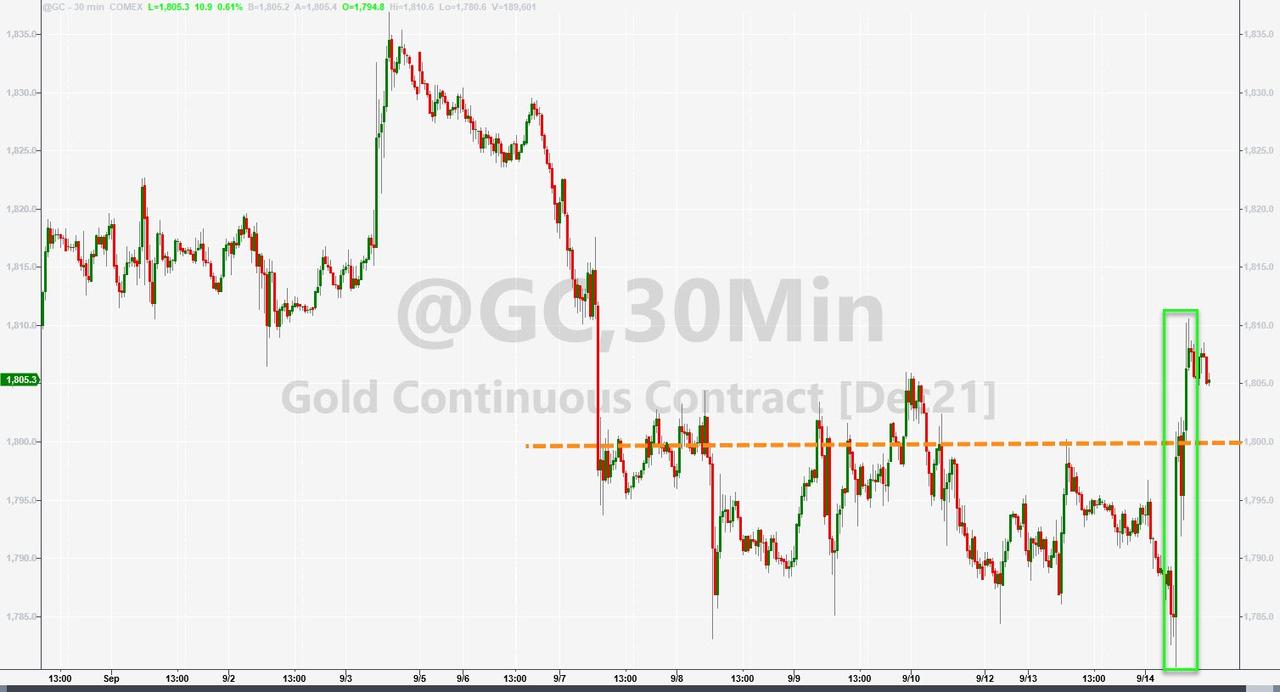
Bond yields plummeted with the 30-year heading to 6-week lows. The US Dollar index swan dived, reversed, and recovered all its early losses. Every bit of this uncertainty proved to be a boon for gold, with the precious metal not only gaining 0.68% but also climbing back above its $1,800 level.
With Friday’s quadruple witching hour (options expirations) on deck, it looks like volatility will be with us for a while.
2. ETFs in the Spotlight
In case you missed the announcement and description of this section, you can read it here again.
It features some of the 10 broadly diversified domestic and sector ETFs from my HighVolume list as posted every Saturday. Furthermore, they are screened for the lowest MaxDD% number meaning they have been showing better resistance to temporary sell offs than all others over the past year.
The below table simply demonstrates the magnitude with which these ETFs are fluctuating above or below their respective individual trend lines (%+/-M/A). A break below, represented by a negative number, shows weakness, while a break above, represented by a positive percentage, shows strength.
For hundreds of ETF choices, be sure to reference Thursday’s StatSheet.
For this current domestic “Buy” cycle, here’s how some our candidates have fared:
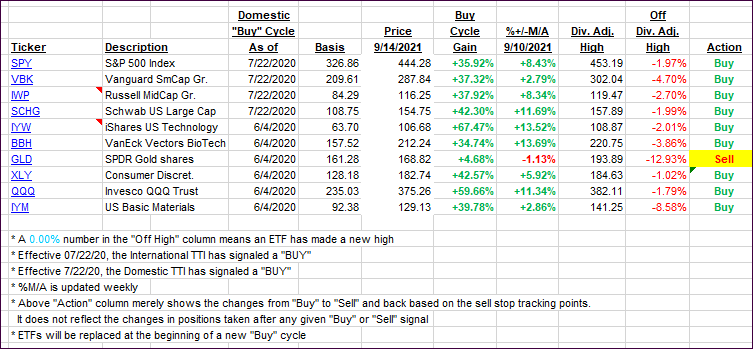
Click image to enlarge.
Again, the %+/-M/A column above shows the position of the various ETFs in relation to their respective long-term trend lines, while the trailing sell stops are being tracked in the “Off High” column. The “Action” column will signal a “Sell” once the -8% point has been taken out in the “Off High” column. For more volatile sector ETFs, the trigger point is -10%.
3. Trend Tracking Indexes (TTIs)
Our TTIs reversed and headed south with the bears being in charge for this session.
This is how we closed 09/14/2021:
Domestic TTI: +6.70% above its M/A (prior close +7.47%)—Buy signal effective 07/22/2020.
International TTI: +4.46% above its M/A (prior close +5.12%)—Buy signals effective 07/22/2020.
Disclosure: I am obliged to inform you that I, as well as my advisory clients, own some of the ETFs listed in the above table. Furthermore, they do not represent a specific investment recommendation for you, they merely show which ETFs from the universe I track are falling within the specified guidelines.
All linked charts above are courtesy of Bloomberg via ZeroHedge.
Contact Ulli