
- Moving the markets
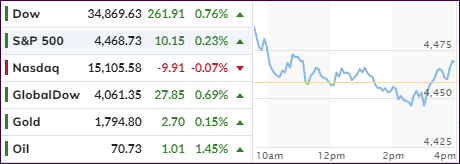
For a change, an early rally maintained its momentum throughout the session, despite a temporary mid-day pullback, with two of the three major indexes finally eking out a gain, following five days of losses. The Nasdaq trailed and closed slightly in the red, after dancing around its unchanged line all day.
Small Caps dipped but “value” ripped, with RPV gaining a solid +1.56% after nibbling at its trailing sell stop last Friday.
Still, today’s bounce back was subdued and a far cry from convincing traders that the bullish theme is back on. After all, we are in the middle of one of the historically most volatile months, during which anything is possible. The S&P 500 was saved only by late-session bidding, which pulled the index out of the red.
Spraying to all fields:
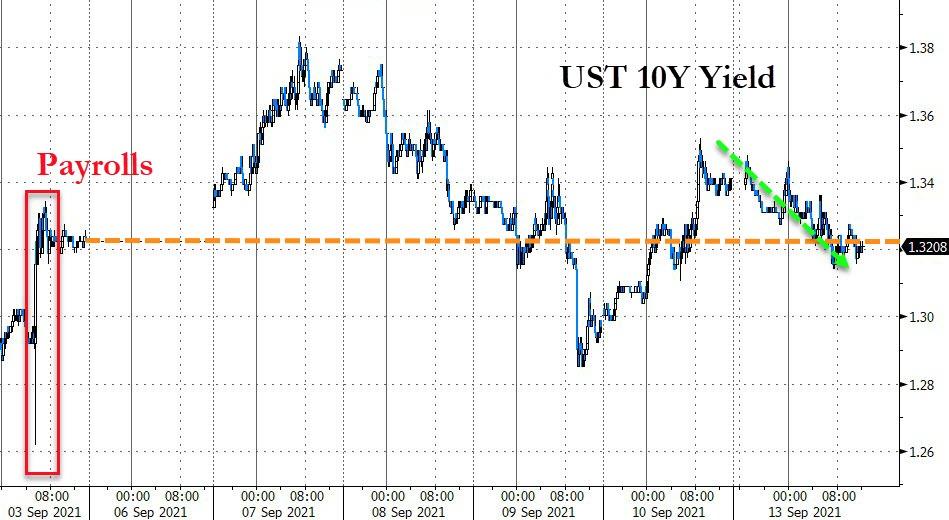
Bond yields dropped, as nervousness over the upcoming debt ceiling debacle moved front and center.
The US Dollar bounced without clear direction but managed to hang on to modest gains.
Gold popped and dropped but ended slightly higher yet still short of recapturing its $1,800 level.
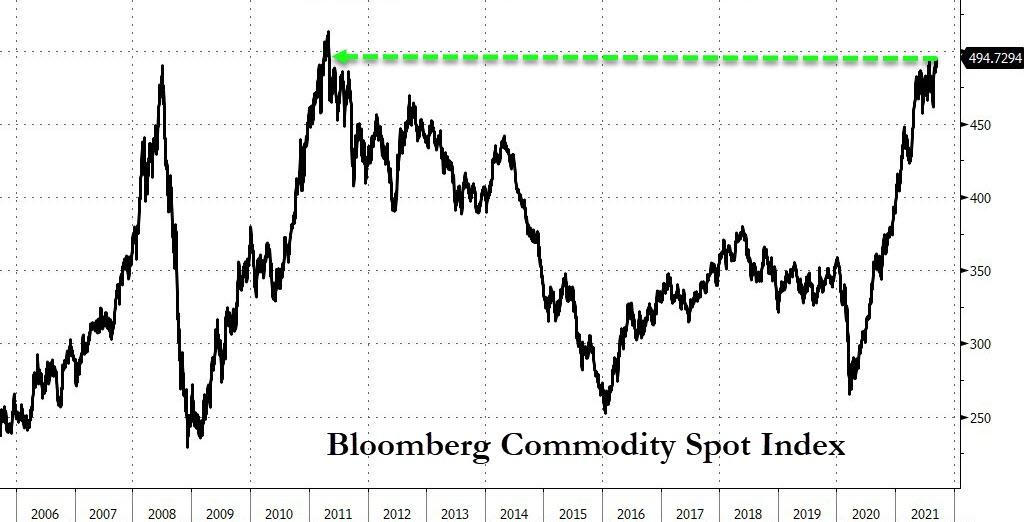
Inflation is here to stay, despite jawboning to the contrary, as the Commodity Spot Index rallied to a 10-year high.
This week’s posting schedule will be slightly different due to me being out of town on Friday. You can see the latest update here.
2. ETFs in the Spotlight
In case you missed the announcement and description of this section, you can read it here again.
It features some of the 10 broadly diversified domestic and sector ETFs from my HighVolume list as posted every Saturday. Furthermore, they are screened for the lowest MaxDD% number meaning they have been showing better resistance to temporary sell offs than all others over the past year.
The below table simply demonstrates the magnitude with which these ETFs are fluctuating above or below their respective individual trend lines (%+/-M/A). A break below, represented by a negative number, shows weakness, while a break above, represented by a positive percentage, shows strength.
For hundreds of ETF choices, be sure to reference Thursday’s StatSheet.
For this current domestic “Buy” cycle, here’s how some our candidates have fared:
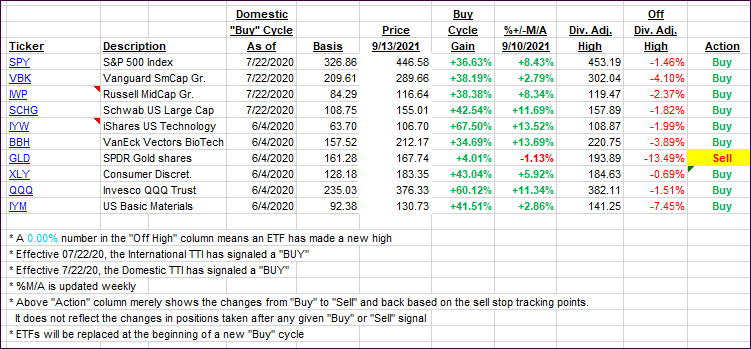
Click image to enlarge.
Again, the %+/-M/A column above shows the position of the various ETFs in relation to their respective long-term trend lines, while the trailing sell stops are being tracked in the “Off High” column. The “Action” column will signal a “Sell” once the -8% point has been taken out in the “Off High” column. For more volatile sector ETFs, the trigger point is -10%.
3. Trend Tracking Indexes (TTIs)
Our TTIs finally managed a modest bounce back after five days of slippage.
This is how we closed 09/13/2021:
Domestic TTI: +7.47% above its M/A (prior close +7.17%)—Buy signal effective 07/22/2020.
International TTI: +5.12% above its M/A (prior close +4.31%)—Buy signals effective 07/22/2020.
Disclosure: I am obliged to inform you that I, as well as my advisory clients, own some of the ETFs listed in the above table. Furthermore, they do not represent a specific investment recommendation for you, they merely show which ETFs from the universe I track are falling within the specified guidelines.
All linked charts above are courtesy of Bloomberg via ZeroHedge.
Contact Ulli