
- Moving the markets
As I posted yesterday, more of the same was indeed how this session turned out. Traders stayed away from making new commitments and, due to lack of buying enthusiasm, the markets drifted aimlessly ahead of tomorrow’s Fed announcement.
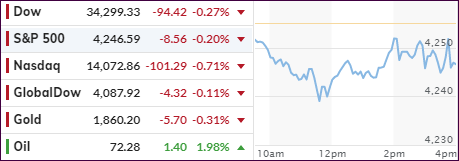
Although the major indexes wandered into the red, keep in mind that they are still within striking distance of new all-time highs, so this two-day slippage is meaningless.
Looking at the big picture, the tech sector surrendered yesterday’s gains, as “value” was favored over “growth” today, with RPV managing a +0.35% gain while Small Caps hit the skids by given back -0.98%.
On the economic front, retail sales for May fell 1.3%, worse than an expected 0.7%, and the Producer Price Index rose 0.8% vs. an anticipated 0.6%. While these numbers had a negative market effect, this was mitigated somewhat by the upcoming Fed meeting results due out on Wednesday.
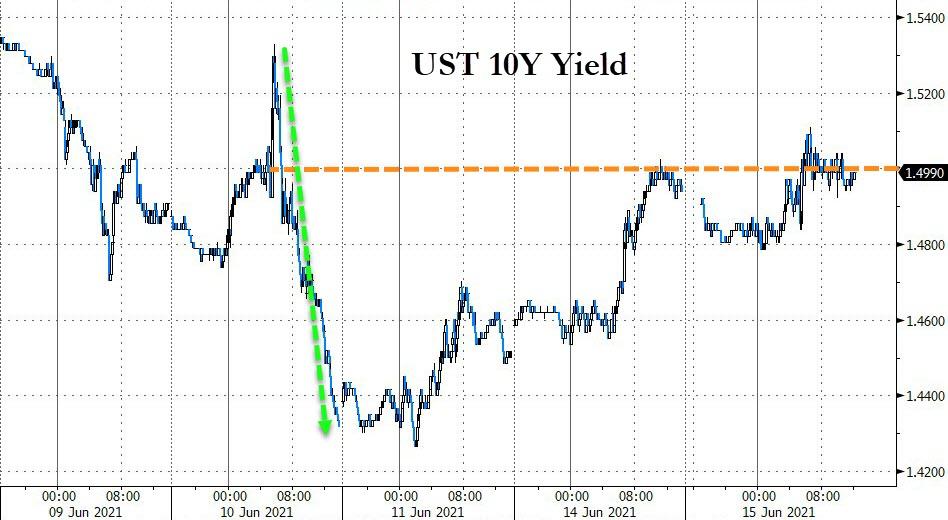
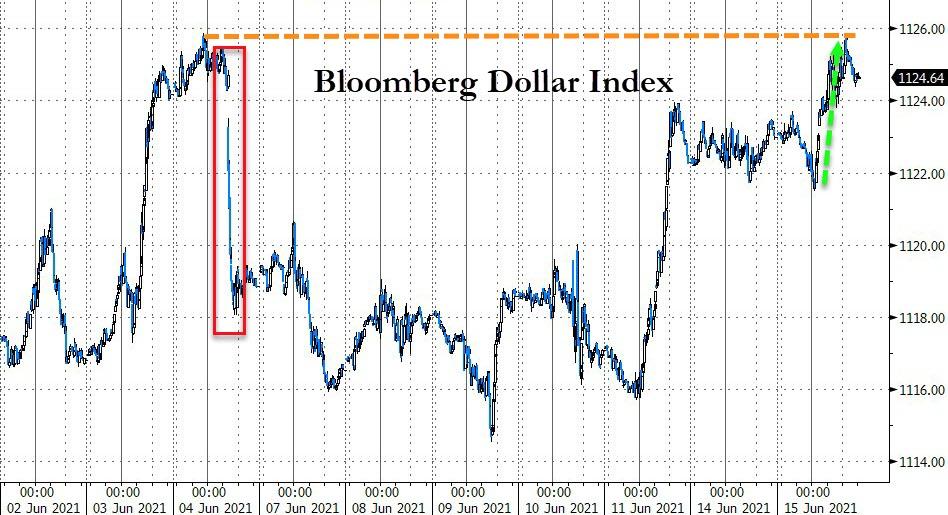
Bond yields pretty much trod water, but the US Dollar broke out of its short-term sideways pattern and touched its June 4th highs. As is the case when dollar rallies, Gold lost its luster for this session and gave back -0.30%.
Concluded ZeroHedge:
Finally, the dismal disappointment in retail sales today, combined with Empire Manufacturing’s miss, a worse than anticipated drop in homebuilder confidence, and a bigger than expected drop in business inventories, the US macro surprise index fell to its lowest since May 2020…
2. ETFs in the Spotlight
In case you missed the announcement and description of this section, you can read it here again.
It features some of the 10 broadly diversified domestic and sector ETFs from my HighVolume list as posted every Saturday. Furthermore, they are screened for the lowest MaxDD% number meaning they have been showing better resistance to temporary sell offs than all others over the past year.
The below table simply demonstrates the magnitude with which these ETFs are fluctuating above or below their respective individual trend lines (%+/-M/A). A break below, represented by a negative number, shows weakness, while a break above, represented by a positive percentage, shows strength.
For hundreds of ETF choices, be sure to reference Thursday’s StatSheet.
For this current domestic “Buy” cycle, here’s how some our candidates have fared:
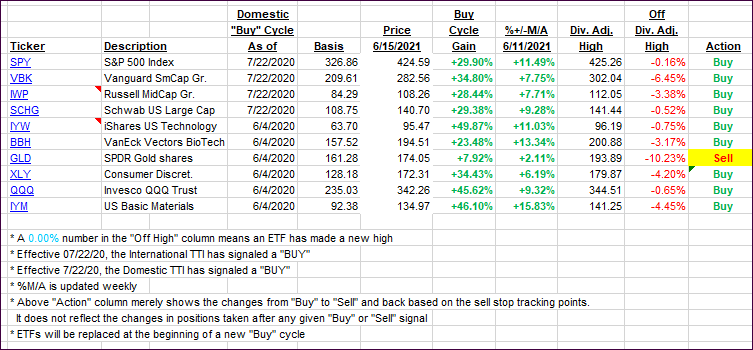
Click image to enlarge.
Again, the %+/-M/A column above shows the position of the various ETFs in relation to their respective long-term trend lines, while the trailing sell stops are being tracked in the “Off High” column. The “Action” column will signal a “Sell” once the -8% point has been taken out in the “Off High” column. For more volatile sector ETFs, the trigger point is -10%.
3. Trend Tracking Indexes (TTIs)
Our TTIs barely changed as anticipation of tomorrow’s Fed announcement reigned supreme.
This is how we closed 06/15/2021:
Domestic TTI: +15.52% above its M/A (prior close +15.50%)—Buy signal effective 07/22/2020.
International TTI: +14.32% above its M/A (prior close +14.25%)—Buy signals effective 07/22/2020.
Disclosure: I am obliged to inform you that I, as well as my advisory clients, own some of the ETFs listed in the above table. Furthermore, they do not represent a specific investment recommendation for you, they merely show which ETFs from the universe I track are falling within the specified guidelines.
All linked charts above are courtesy of Bloomberg via ZeroHedge.
Contact Ulli