
- Moving the markets
Despite the Fed leaving interest rates unchanged for the time being, it was the outlook that disturbed the bulls today. Inflation expectations were raised to 3.4% for 2021, which is 1% higher than the March projection.
The time frame as to when rate hikes might occur was moved to 2023, during which two increases are now projected. That came as a surprise after March’s announcement that such action may not be on deck until at least 2024.
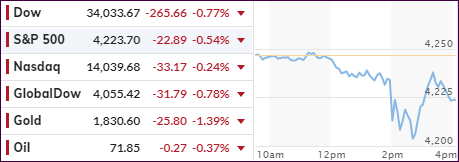
The broad market dumped, including all 11 S&P sectors showing red numbers at one point, and there was no escape to safety. Apparently, beliefs were that the Fed would sit on its hands, so today’s hint that rates will need to rise sooner and faster, came as a surprise.
Regarding the Fed’s monthly $120 billion bond buying program, designed to keep bond yields low and make debt service feasible, no changes were announced.
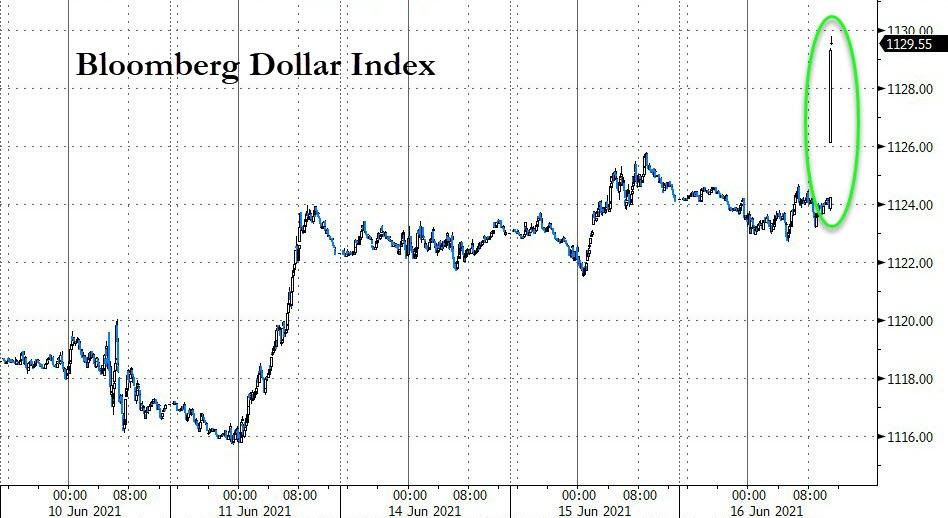
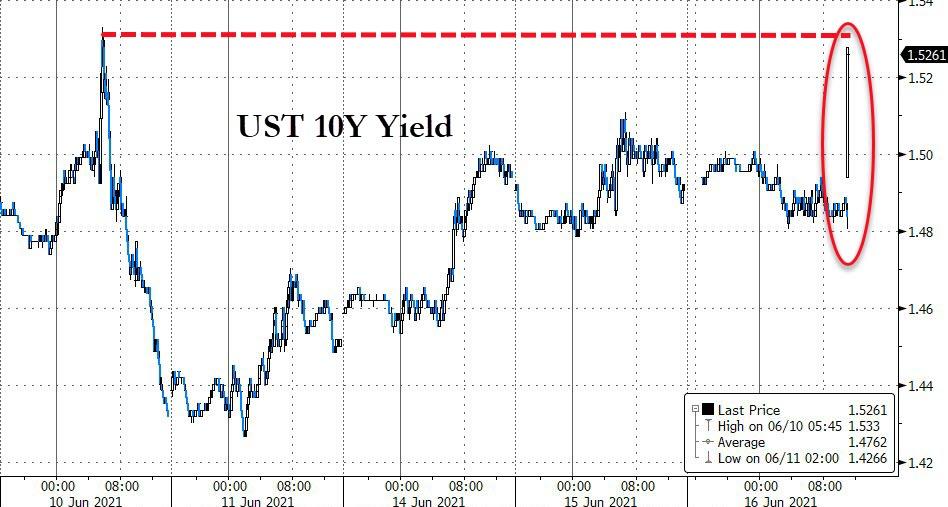
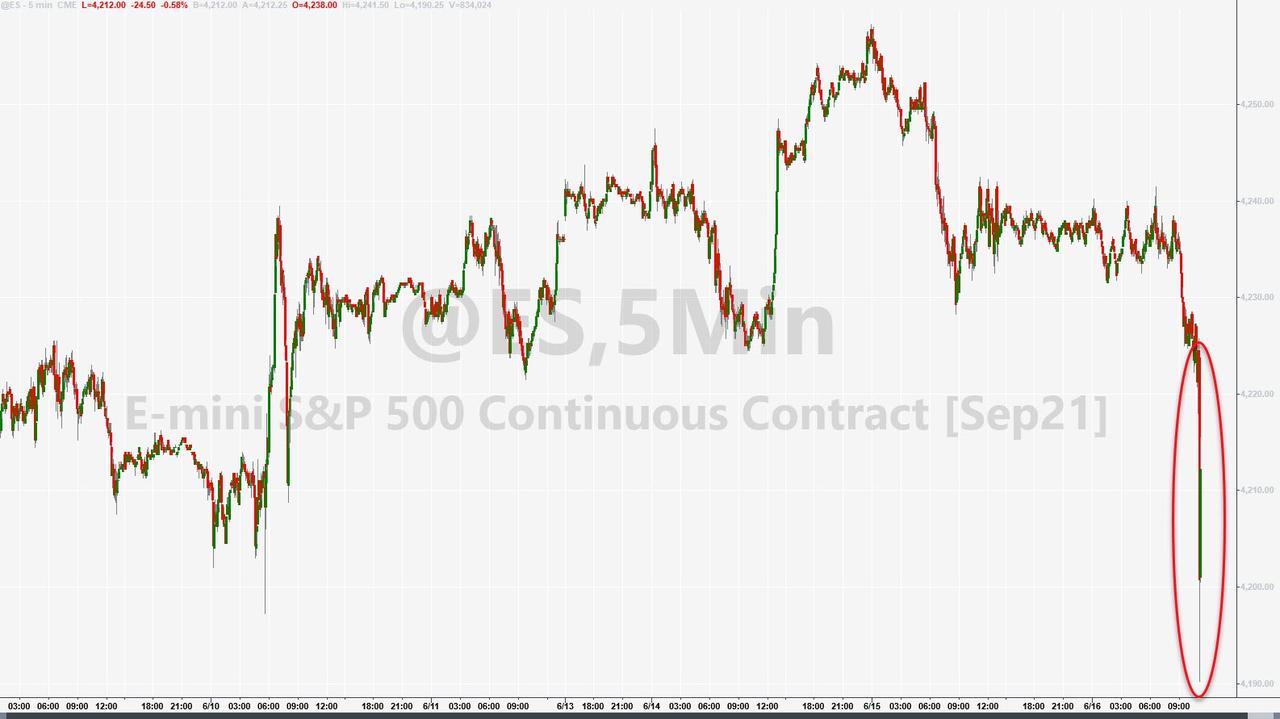
The fallout was instant, as the US Dollar surged and bond yields rose, which caused stocks to tumble and Gold to dive.
The big question is this one: “Can the markets absorb this news without much damage, or will sentiment favor the bears from hereon forward?”
We will find out over the next few days.
2. ETFs in the Spotlight
In case you missed the announcement and description of this section, you can read it here again.
It features some of the 10 broadly diversified domestic and sector ETFs from my HighVolume list as posted every Saturday. Furthermore, they are screened for the lowest MaxDD% number meaning they have been showing better resistance to temporary sell offs than all others over the past year.
The below table simply demonstrates the magnitude with which these ETFs are fluctuating above or below their respective individual trend lines (%+/-M/A). A break below, represented by a negative number, shows weakness, while a break above, represented by a positive percentage, shows strength.
For hundreds of ETF choices, be sure to reference Thursday’s StatSheet.
For this current domestic “Buy” cycle, here’s how some our candidates have fared:
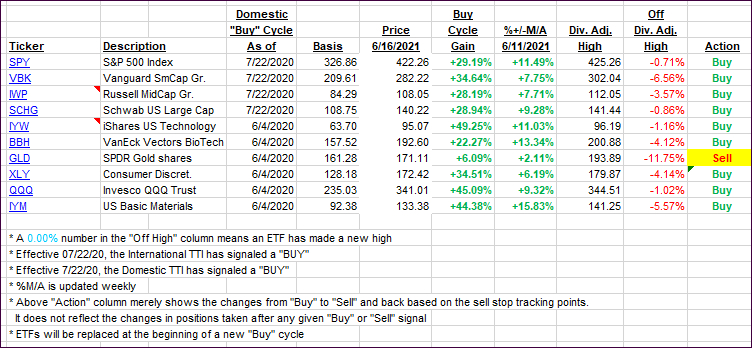
Click image to enlarge.
Again, the %+/-M/A column above shows the position of the various ETFs in relation to their respective long-term trend lines, while the trailing sell stops are being tracked in the “Off High” column. The “Action” column will signal a “Sell” once the -8% point has been taken out in the “Off High” column. For more volatile sector ETFs, the trigger point is -10%.
3. Trend Tracking Indexes (TTIs)
Our TTIs retreated because the Fed’s announcement on interest rates turned out not to be market friendly.
This is how we closed 06/16/2021:
Domestic TTI: +14.73% above its M/A (prior close +15.52%)—Buy signal effective 07/22/2020.
International TTI: +13.42% above its M/A (prior close +14.32%)—Buy signals effective 07/22/2020.
Disclosure: I am obliged to inform you that I, as well as my advisory clients, own some of the ETFs listed in the above table. Furthermore, they do not represent a specific investment recommendation for you, they merely show which ETFs from the universe I track are falling within the specified guidelines.
All linked charts above are courtesy of Bloomberg via ZeroHedge.
Contact Ulli