
- Moving the markets
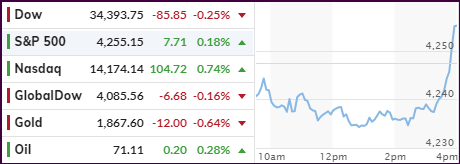
Red numbers were the theme this morning with the Dow and S&P 500 hovering below their respective unchanged lines with the former showing far more weakness than the latter. Resisting the early bearish mood was the Nasdaq, which maintained its bullish position, built on it throughout the session and ended it with a gain of 0.74%.
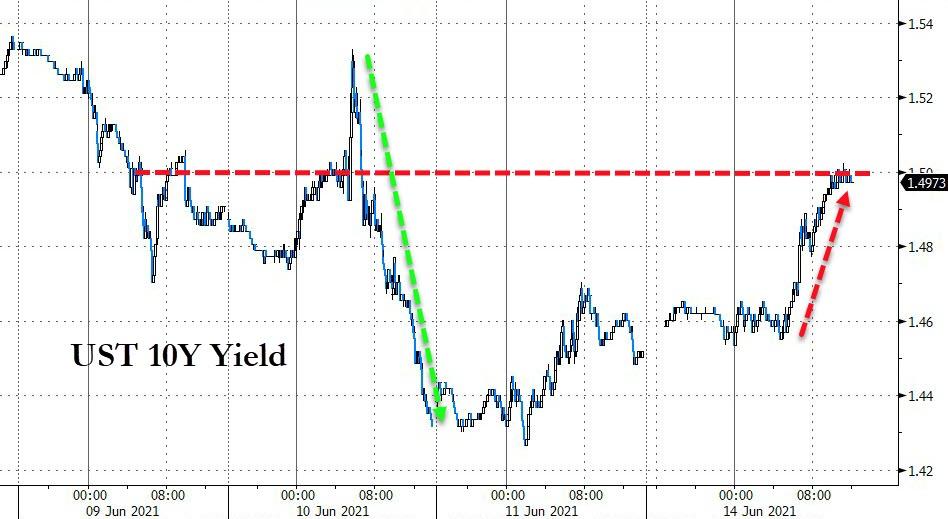
With bond yields rising today, but having shown weakness recently, traders drifted away from “value” investments in favor of “growth”—at least for the moment. Looking at the big picture, today was another quiet one, such as we’ve seen recently, and which is a sign of June’s historical trading patterns.
Of course, several concerns are ever-present, like looming inflation and potential moves by the Fed. Investor sentiment will be influenced by the Fed’s two-day policy meeting with the results due out around noon on Wednesday.
Hopes are high that the Central Bank will not announce any changes, but any future forecasts for interest rates, the economy and the elephant in the room, inflation, could easily affect market direction.
At the closing bell, markets were flat, but a last 30-minute ramp pushed the S&P 500 into record territory by the tiniest of margins, with the index ending the day up a puny +0.18%.
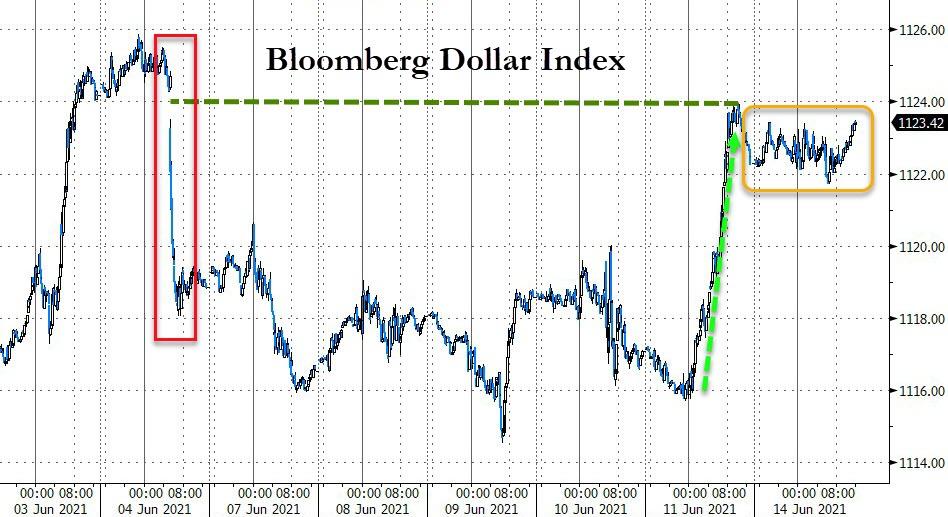
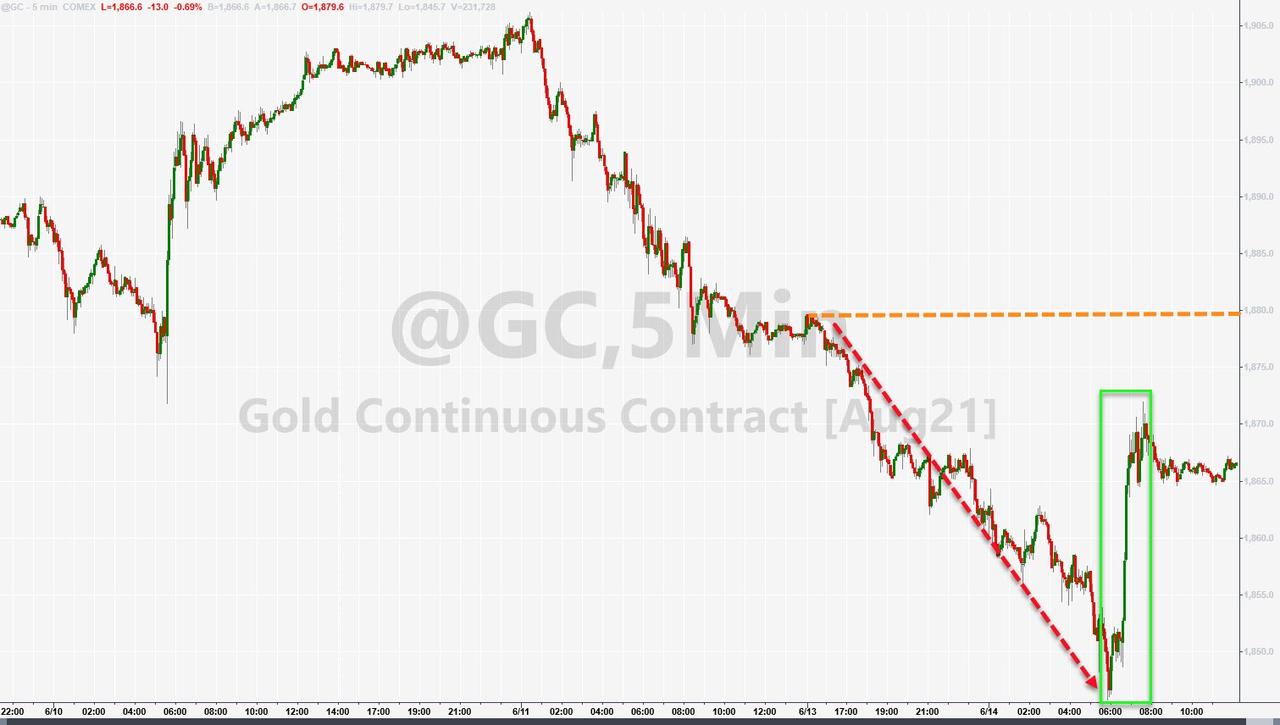
The 10-year yield continued its bounce off last week’s lows and, in combination with the US Dollar’s holding on to Friday’s gains, kept Gold in check with the precious metal ending lower by -0.64%.
I expect more of the same until Wednesday noon, at which time the Fed will have hopefully clarified its near-term policy.
2. ETFs in the Spotlight
In case you missed the announcement and description of this section, you can read it here again.
It features some of the 10 broadly diversified domestic and sector ETFs from my HighVolume list as posted every Saturday. Furthermore, they are screened for the lowest MaxDD% number meaning they have been showing better resistance to temporary sell offs than all others over the past year.
The below table simply demonstrates the magnitude with which these ETFs are fluctuating above or below their respective individual trend lines (%+/-M/A). A break below, represented by a negative number, shows weakness, while a break above, represented by a positive percentage, shows strength.
For hundreds of ETF choices, be sure to reference Thursday’s StatSheet.
For this current domestic “Buy” cycle, here’s how some our candidates have fared:
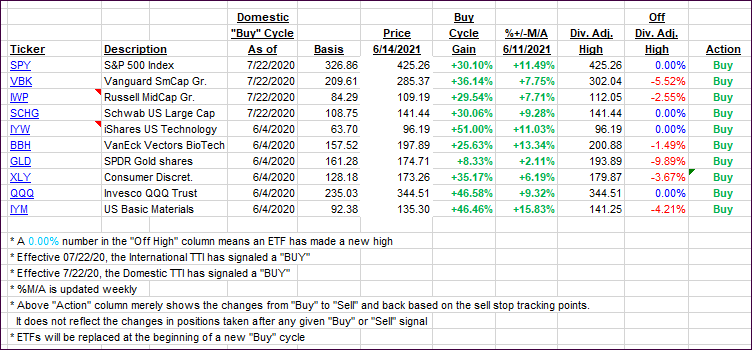
Click image to enlarge.
Again, the %+/-M/A column above shows the position of the various ETFs in relation to their respective long-term trend lines, while the trailing sell stops are being tracked in the “Off High” column. The “Action” column will signal a “Sell” once the -8% point has been taken out in the “Off High” column. For more volatile sector ETFs, the trigger point is -10%.
3. Trend Tracking Indexes (TTIs)
Our TTIs skidded a bit, as broad market direction was flat.
This is how we closed 06/14/2021:
Domestic TTI: +15.50% above its M/A (prior close +15.86%)—Buy signal effective 07/22/2020.
International TTI: +14.25% above its M/A (prior close +14.43%)—Buy signals effective 07/22/2020.
Disclosure: I am obliged to inform you that I, as well as my advisory clients, own some of the ETFs listed in the above table. Furthermore, they do not represent a specific investment recommendation for you, they merely show which ETFs from the universe I track are falling within the specified guidelines.
All linked charts above are courtesy of Bloomberg via ZeroHedge.
Contact Ulli