
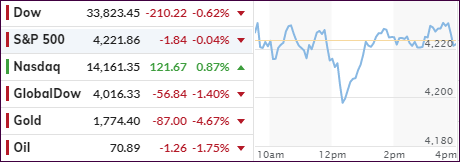
- Moving the markets
The morning, after the Fed’s announcement that it envisions two rate hikes in 2023, thereby subtly admitting that inflation may not be transitory, traders were shocked to see today’s market reaction, as this chart demonstrates.
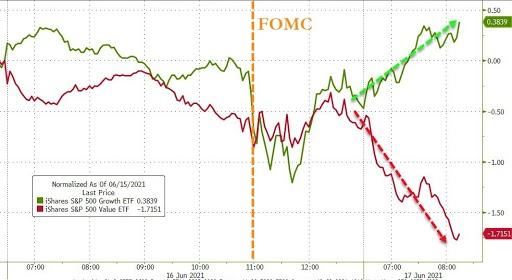
ZeroHege described it this way:
Traders are watching in stunned amazement at what is going on in the market where contrary to everything the Fed has said, we are seeing a stampede into tech, growth, and duration-sensitive names…and a flight out of reflation and value sectors…
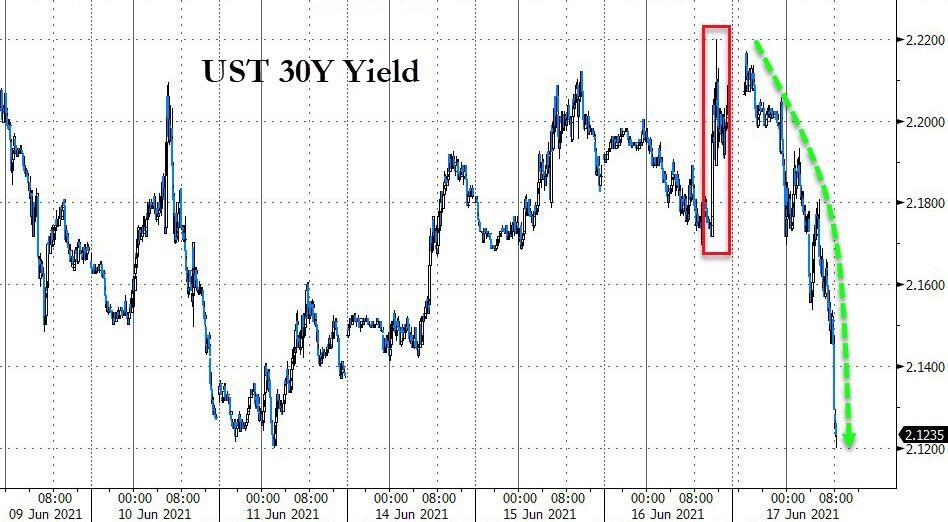
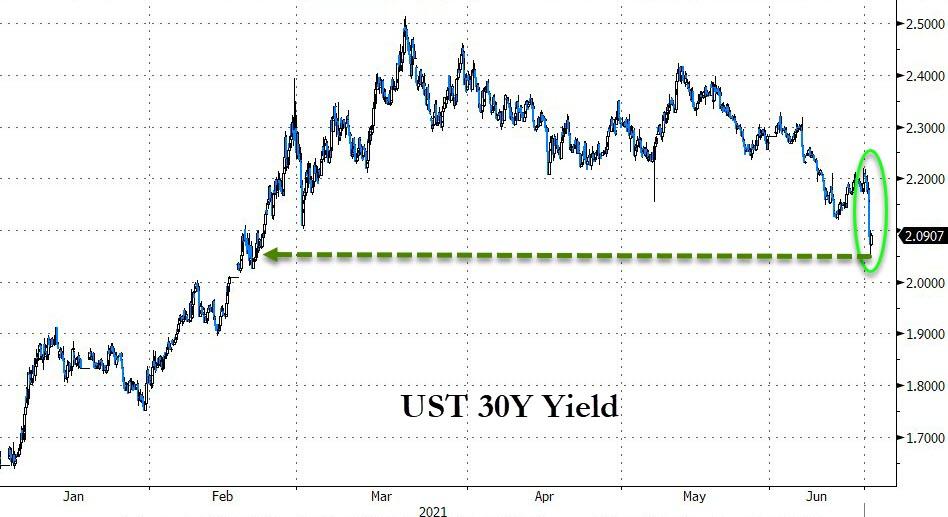
Bonds were in a world of their own when, after yesterday’s yield spike, which represented a normal reaction to potentially higher rates, opposite day arrived and slammed yields lower back down to the June 11 level. The 30-year yield crashed down to a price last seen on November 20.
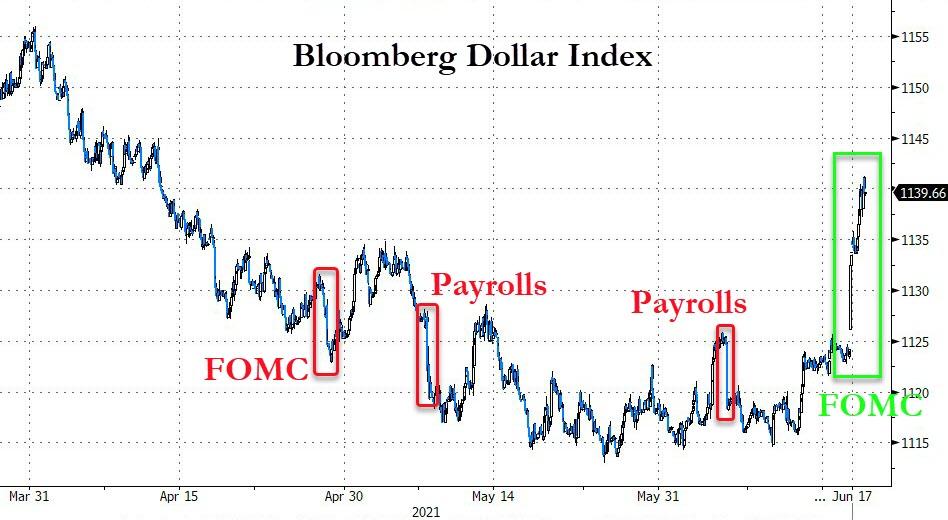
Huh? Even seasoned traders watched this unreal development open-mouthed and were not able to come up with a reasonable explanation. Bank stocks got hit hard, which pushed the Financial Sector ETF down -2.90%. The US Dollar surged for the 5th straight day, as ZeroHege pointed out, thereby clubbing Gold like a baby seal, which slumped -4.68% and dropped below its $1,800 level. Ouch!
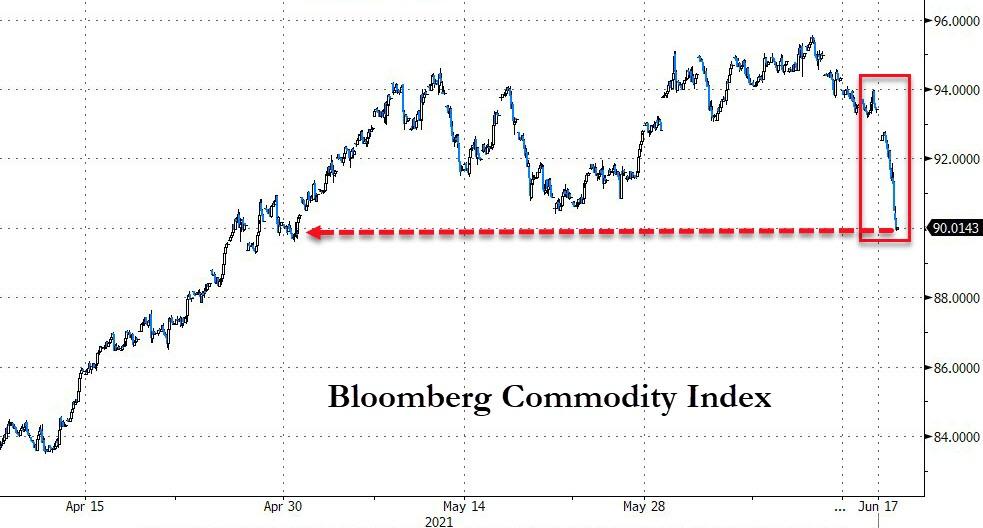
It was a day where nothing made sense and even the inflation-sensitive commodity sector got annihilated and suffered its biggest drop since March 2020. In other words, things that should not have happened did happen.
In the end, it may not have been the Fed causing havoc in some market sectors, but what is about to take place tomorrow. That is massive options expirations in SPX and QQQ with a total value of some $2 trillion!
What we saw today may have been just a front run of tomorrow’s main feature.
2. ETFs in the Spotlight
In case you missed the announcement and description of this section, you can read it here again.
It features some of the 10 broadly diversified domestic and sector ETFs from my HighVolume list as posted every Saturday. Furthermore, they are screened for the lowest MaxDD% number meaning they have been showing better resistance to temporary sell offs than all others over the past year.
The below table simply demonstrates the magnitude with which these ETFs are fluctuating above or below their respective individual trend lines (%+/-M/A). A break below, represented by a negative number, shows weakness, while a break above, represented by a positive percentage, shows strength.
For hundreds of ETF choices, be sure to reference Thursday’s StatSheet.
For this current domestic “Buy” cycle, here’s how some our candidates have fared:
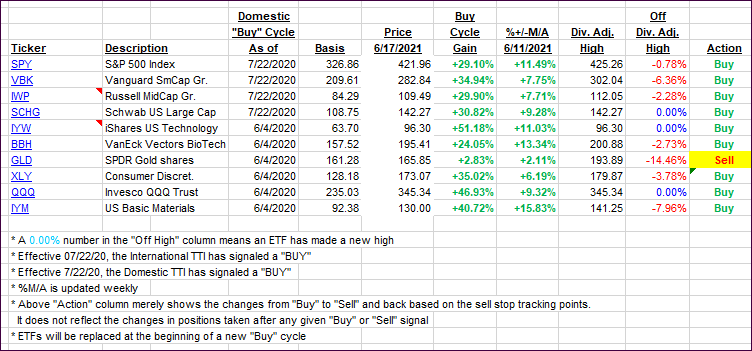
Click image to enlarge.
Again, the %+/-M/A column above shows the position of the various ETFs in relation to their respective long-term trend lines, while the trailing sell stops are being tracked in the “Off High” column. The “Action” column will signal a “Sell” once the -8% point has been taken out in the “Off High” column. For more volatile sector ETFs, the trigger point is -10%.
3. Trend Tracking Indexes (TTIs)
Our TTIs got spanked today when the broad market swung wildly.
This is how we closed 06/17/2021:
Domestic TTI: +13.59% above its M/A (prior close +14.73%)—Buy signal effective 07/22/2020.
International TTI: +12.31% above its M/A (prior close +13.42%)—Buy signals effective 07/22/2020.
Disclosure: I am obliged to inform you that I, as well as my advisory clients, own some of the ETFs listed in the above table. Furthermore, they do not represent a specific investment recommendation for you, they merely show which ETFs from the universe I track are falling within the specified guidelines.
All linked charts above are courtesy of Bloomberg via ZeroHedge.
Contact Ulli