
- Moving the markets
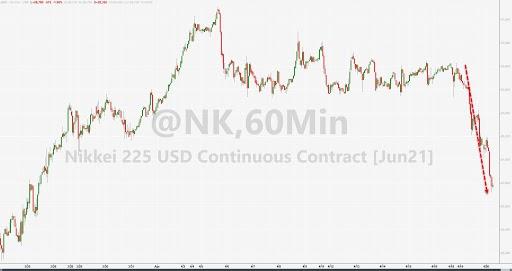
Overnight, the Japanese markets painted a gloomy picture, as Tokyo pushed for a third COVID state of emergency with new cases spiking. Full-fledged lockdowns are being considered with the IOC possibly canceling this summer’s Olympics.
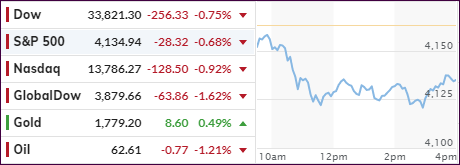
That gloomy mood carried over into the US markets, with major indexes opening to the downside but never managing to stage any kind of recovery. A last hour bounce reduced losses somewhat, but the overall tone remained bearish.
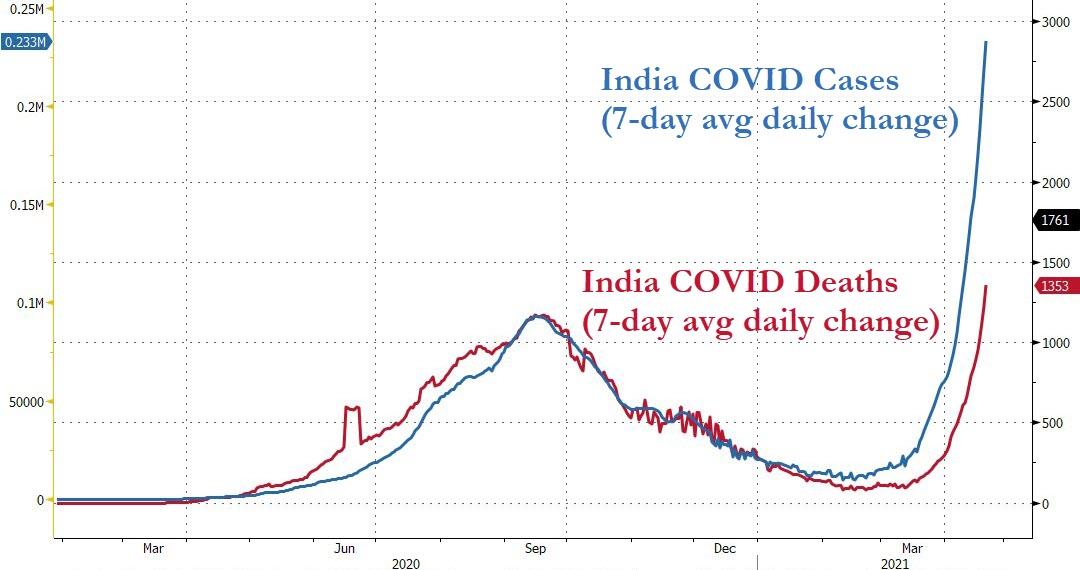
Even strong corporate earnings did not provide enough ammo to improve market sentiment. On a global basis, Covid cases in India followed Japan’s example, thereby questioning the much hoped for positive reopening scenario.
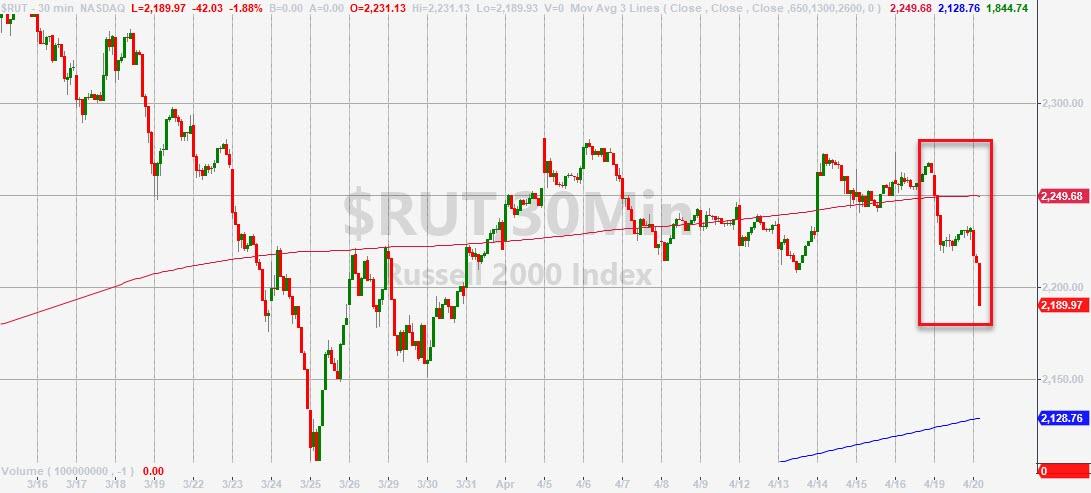
Airlines led the surge to lower prices, after UA reported its fifth consecutive quarterly loss. SmallCaps, which started the year with a bang, puked today with the Russell 2000 dropping below its 50-day M/A with not much support down to its 100-day M/A, according to ZH.
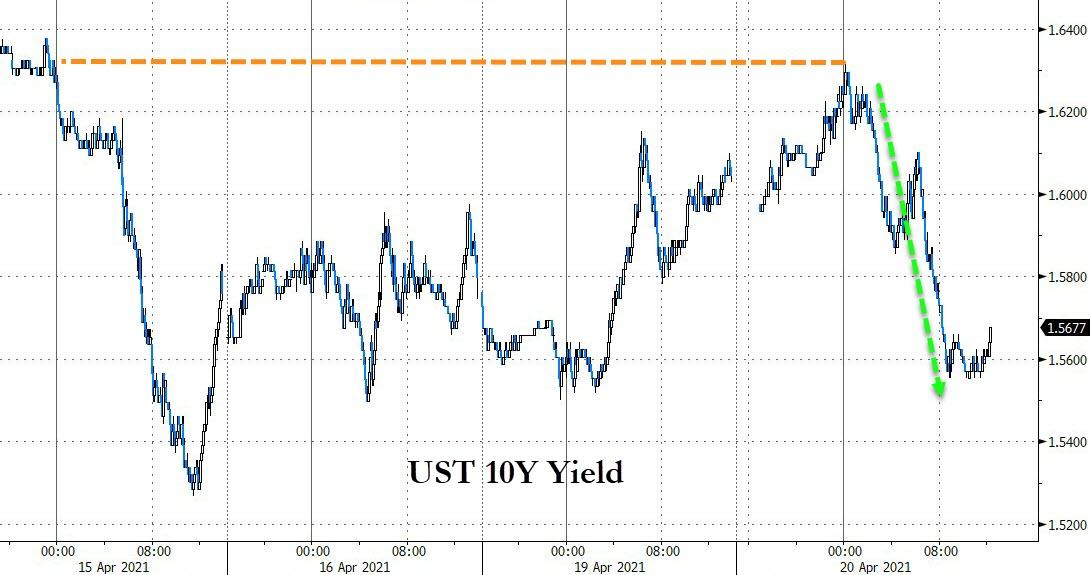
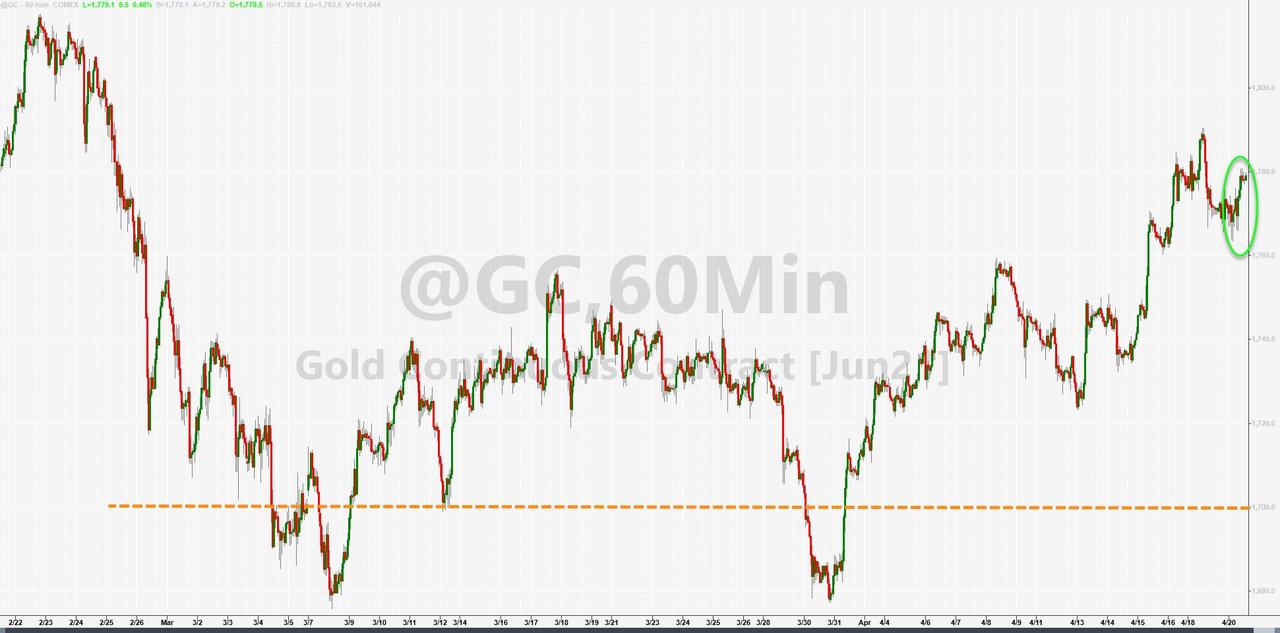
With so much uncertainty, bond prices benefited as yields slid below 1.6%, allowing Gold to add a modest 0.46%, which was one of the few green numbers we saw today. The US Dollar also rebounded from a recent steep sell off and did not affect gold negatively, which is odd.
Right now, the markets look somewhat frothy and overbought, which why we are seeing this correction. After all, we just witnessed new ATHs for the Dow and S&P 500 last Friday.
2. ETFs in the Spotlight
In case you missed the announcement and description of this section, you can read it here again.
It features some of the 10 broadly diversified domestic and sector ETFs from my HighVolume list as posted every Saturday. Furthermore, they are screened for the lowest MaxDD% number meaning they have been showing better resistance to temporary sell offs than all others over the past year.
The below table simply demonstrates the magnitude with which these ETFs are fluctuating above or below their respective individual trend lines (%+/-M/A). A break below, represented by a negative number, shows weakness, while a break above, represented by a positive percentage, shows strength.
For hundreds of ETF choices, be sure to reference Thursday’s StatSheet.
For this current domestic “Buy” cycle, here’s how some our candidates have fared:
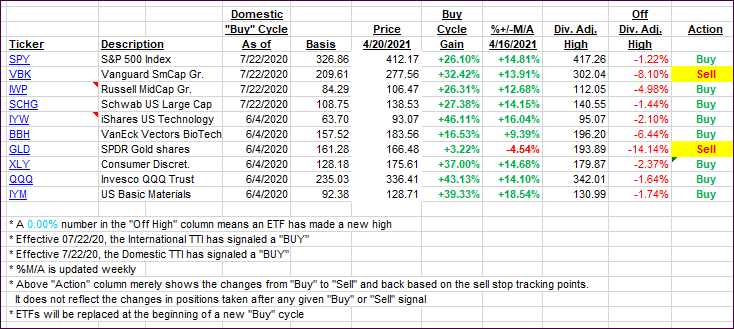
Click image to enlarge.
Again, the %+/-M/A column above shows the position of the various ETFs in relation to their respective long-term trend lines, while the trailing sell stops are being tracked in the “Off High” column. The “Action” column will signal a “Sell” once the -8% point has been taken out in the “Off High” column. For more volatile sector ETFs, the trigger point is -10%.
3. Trend Tracking Indexes (TTIs)
Our TTIs headed south as bullish momentum was conspicuously absent.
This is how we closed 4/20/2021:
Domestic TTI: +18.51% above its M/A (prior close +19.40%)—Buy signal effective 07/22/2020.
International TTI: +15.14% above its M/A (prior close +17.05%)—Buy signals effective 07/22/2020.
Disclosure: I am obliged to inform you that I, as well as my advisory clients, own some of the ETFs listed in the above table. Furthermore, they do not represent a specific investment recommendation for you, they merely show which ETFs from the universe I track are falling within the specified guidelines.
Contact Ulli