
- Moving the markets
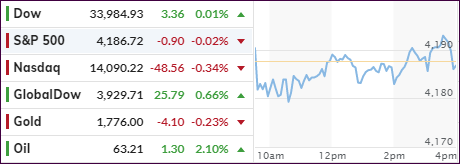
After having closed at record levels yesterday, the S&P 500 and Nasdaq traded aimlessly around their respective unchanged lines, with the Dow treading water as well. The Nasdaq has now finalized a rebound from its 11% correction, which began in February.
Tesla shares retreated some 3% despite the company posting a record net income, while UPS shares rallied over 10%, as the company’s revenue was up 27%.
However, this was just the warmup for the big boys with Alphabet, Microsoft and AMD reporting this afternoon, as Apple and Facebook are due up after tomorrow’s close.
On the economic front, we learned that home prices recorded their biggest gain in 15 years. Consumer Confidence also rose sharply to its highest since February 2020.
Despite the relative calm, SmallCaps had a wild ride on a bronco by pumping and dumping after the opening and again into the close.
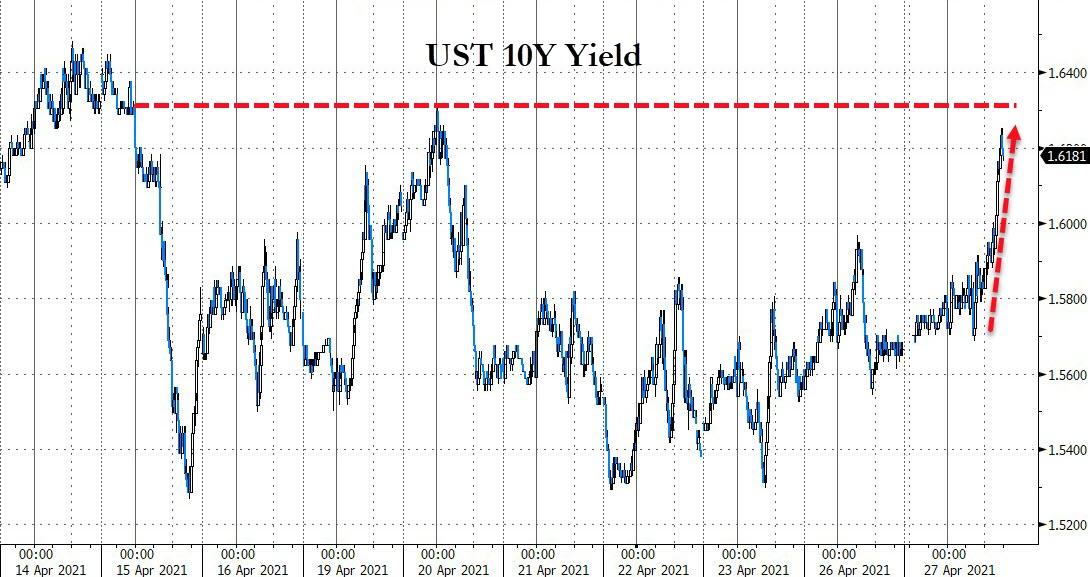
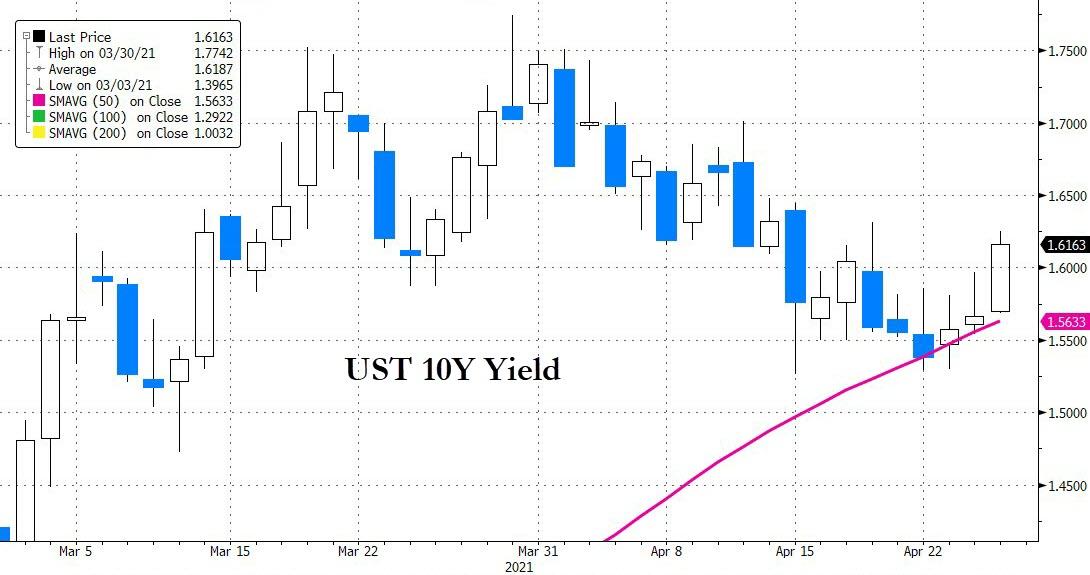
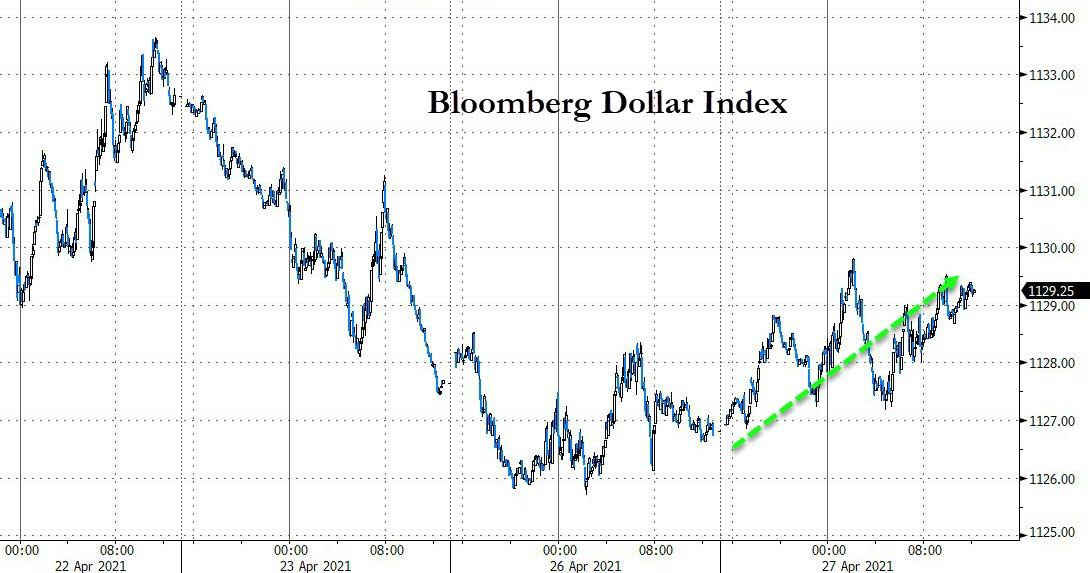
Ahead of tomorrow’s FOMC meeting, bonds sold off as yields rose with the 10-year being supported by its 50-day M/A, according to ZH/Bloomberg. This helped the US Dollar to finally rebound, causing Gold to dip slightly.
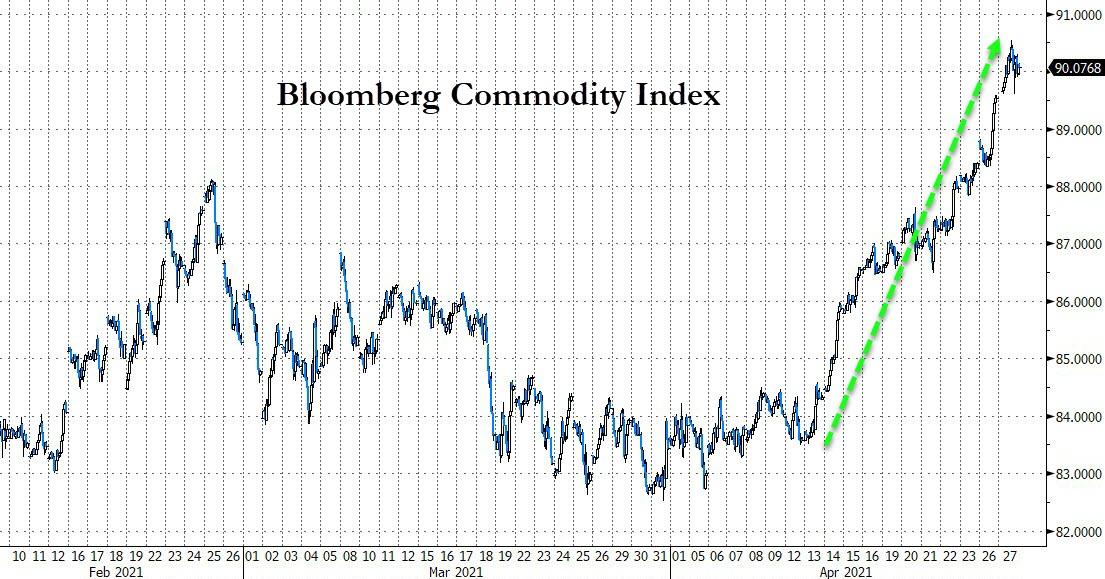
It’s been now the 11th straight day that Commodities have risen, as Bloomberg demonstrates here. Yet, the Fed refuses to acknowledge that inflation is accelerating, or could even be a threat to this economy, and considers it simply transitory. Yeah right.
2. ETFs in the Spotlight
In case you missed the announcement and description of this section, you can read it here again.
It features some of the 10 broadly diversified domestic and sector ETFs from my HighVolume list as posted every Saturday. Furthermore, they are screened for the lowest MaxDD% number meaning they have been showing better resistance to temporary sell offs than all others over the past year.
The below table simply demonstrates the magnitude with which these ETFs are fluctuating above or below their respective individual trend lines (%+/-M/A). A break below, represented by a negative number, shows weakness, while a break above, represented by a positive percentage, shows strength.
For hundreds of ETF choices, be sure to reference Thursday’s StatSheet.
For this current domestic “Buy” cycle, here’s how some our candidates have fared:
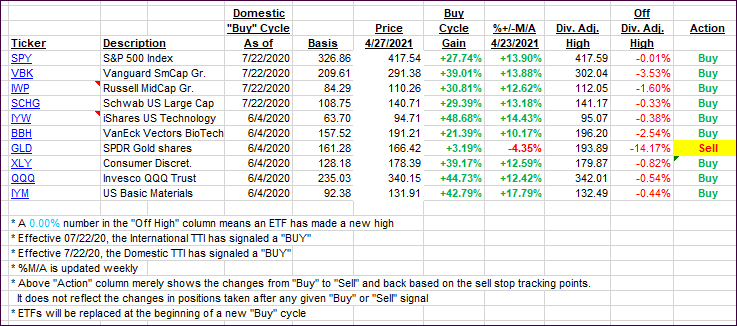
Click image to enlarge.
Again, the %+/-M/A column above shows the position of the various ETFs in relation to their respective long-term trend lines, while the trailing sell stops are being tracked in the “Off High” column. The “Action” column will signal a “Sell” once the -8% point has been taken out in the “Off High” column. For more volatile sector ETFs, the trigger point is -10%.
3. Trend Tracking Indexes (TTIs)
Our TTIs barely changed with the markets treading water.
This is how we closed 4/27/2021:
Domestic TTI: +19.86% above its M/A (prior close +19.73%)—Buy signal effective 07/22/2020.
International TTI: +15.79% above its M/A (prior close +15.73%)—Buy signals effective 07/22/2020.
Disclosure: I am obliged to inform you that I, as well as my advisory clients, own some of the ETFs listed in the above table. Furthermore, they do not represent a specific investment recommendation for you, they merely show which ETFs from the universe I track are falling within the specified guidelines.
Contact Ulli