
- Moving the markets
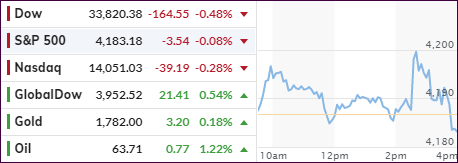
While the futures were flat, the regular session opened with a bounce for the S&P 500, while the Dow and Nasdaq hovered below their respective unchanged lines. In the end, all three indexes meandered aimlessly all day and ended slightly in the red.
The much-expected Fed announcement was a nothing burger with no changes in policy neither in terms of tapering bond purchases nor any potential hike in interest rates. The statement was dovish with optimistic soundbites being offset by downbeat ones, as ZH posted:
…economic activity and employment have strengthened.
Amid progress on vaccinations and strong policy support, indicators of economic activity and employment have strengthened.
The sectors most adversely affected by the pandemic remain weak but have shown improvement.
Yet:
The ongoing public health crisis continues to weigh on the economy, and risks to the economic outlook remain.
And most importantly, “inflation has risen, largely reflecting transitory factors.”
In other words, there was no meat on that bone, neither for the bulls nor for the bears, so we ended up going nowhere.
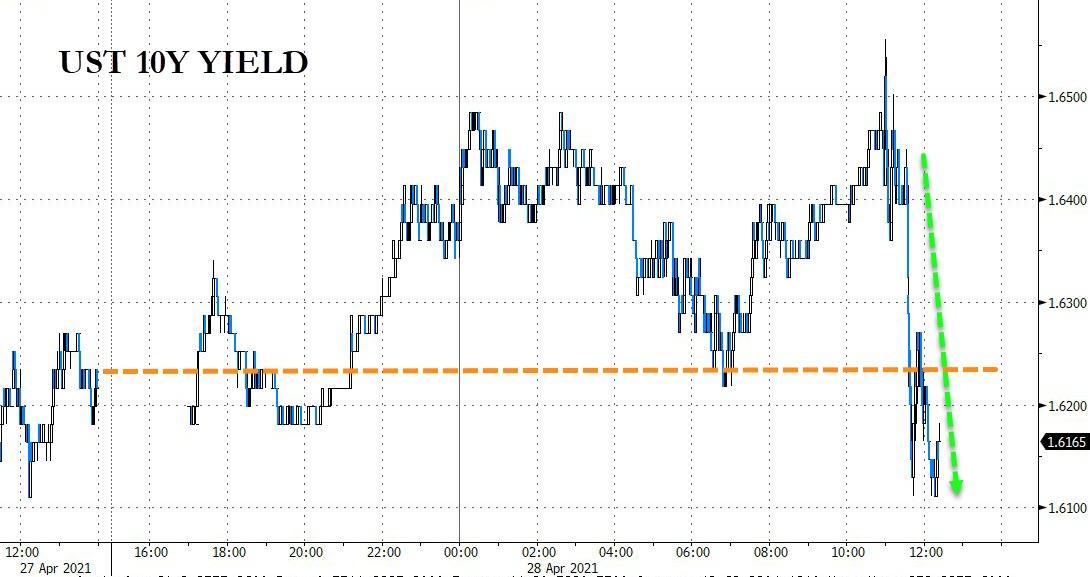
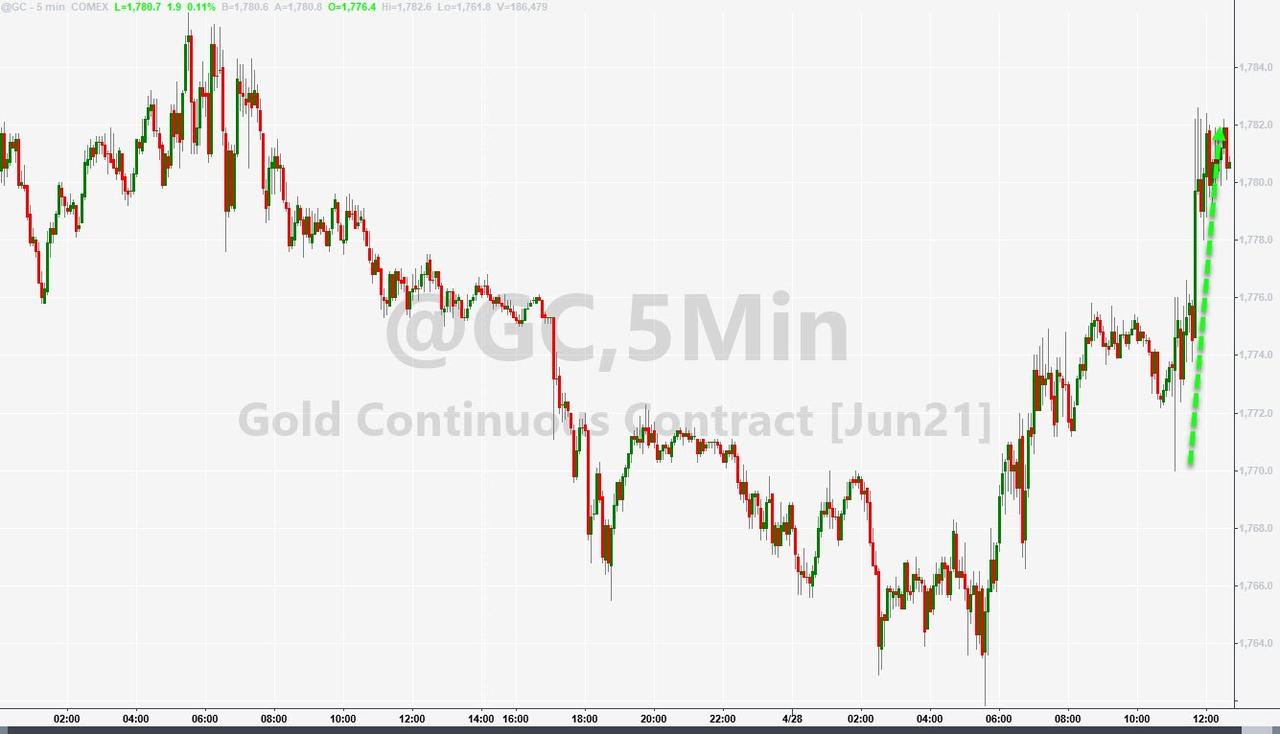
The US Dollar slumped to two-month lows, according to ZH, with bond yields heading south as well, a combination which benefited Gold, but only moderately.
The Nasdaq showed no bullishness either, despite Google parent Alphabet reporting better-than-expected earnings after the bell on Tuesday with its shares rallying 3%. That was offset by Microsoft topping analysts’ estimates as well, yet the stock dipped 2.8%. Go figure…
All eyes are now on Joe Biden’s $1.8 trillion plan in new spending as well as tax credits for families in need. Higher income tax rates and an increase in capital gains taxes will make tonight’s showing one to remember.
2. ETFs in the Spotlight
In case you missed the announcement and description of this section, you can read it here again.
It features some of the 10 broadly diversified domestic and sector ETFs from my HighVolume list as posted every Saturday. Furthermore, they are screened for the lowest MaxDD% number meaning they have been showing better resistance to temporary sell offs than all others over the past year.
The below table simply demonstrates the magnitude with which these ETFs are fluctuating above or below their respective individual trend lines (%+/-M/A). A break below, represented by a negative number, shows weakness, while a break above, represented by a positive percentage, shows strength.
For hundreds of ETF choices, be sure to reference Thursday’s StatSheet.
For this current domestic “Buy” cycle, here’s how some our candidates have fared:
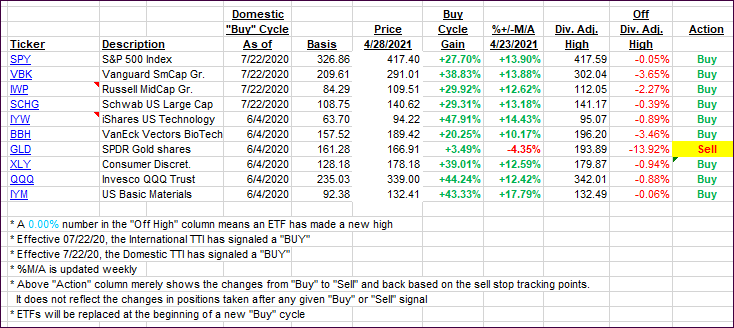
Click image to enlarge.
Again, the %+/-M/A column above shows the position of the various ETFs in relation to their respective long-term trend lines, while the trailing sell stops are being tracked in the “Off High” column. The “Action” column will signal a “Sell” once the -8% point has been taken out in the “Off High” column. For more volatile sector ETFs, the trigger point is -10%.
3. Trend Tracking Indexes (TTIs)
Our TTIs changed only inconsequentially.
This is how we closed 4/28/2021:
Domestic TTI: +19.89% above its M/A (prior close +19.86%)—Buy signal effective 07/22/2020.
International TTI: +16.46% above its M/A (prior close +15.79%)—Buy signals effective 07/22/2020.
Disclosure: I am obliged to inform you that I, as well as my advisory clients, own some of the ETFs listed in the above table. Furthermore, they do not represent a specific investment recommendation for you, they merely show which ETFs from the universe I track are falling within the specified guidelines.
Contact Ulli