
- Moving the markets
With the markets having surged into April, it was time for the pace to slow down, and that is what we saw today.
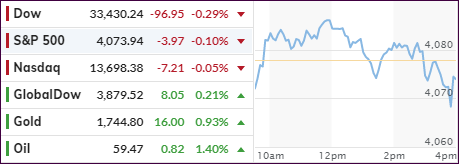
The S&P 500 broke a 3-day winning streak with the indexes coming off their record highs, although by only a small margin.
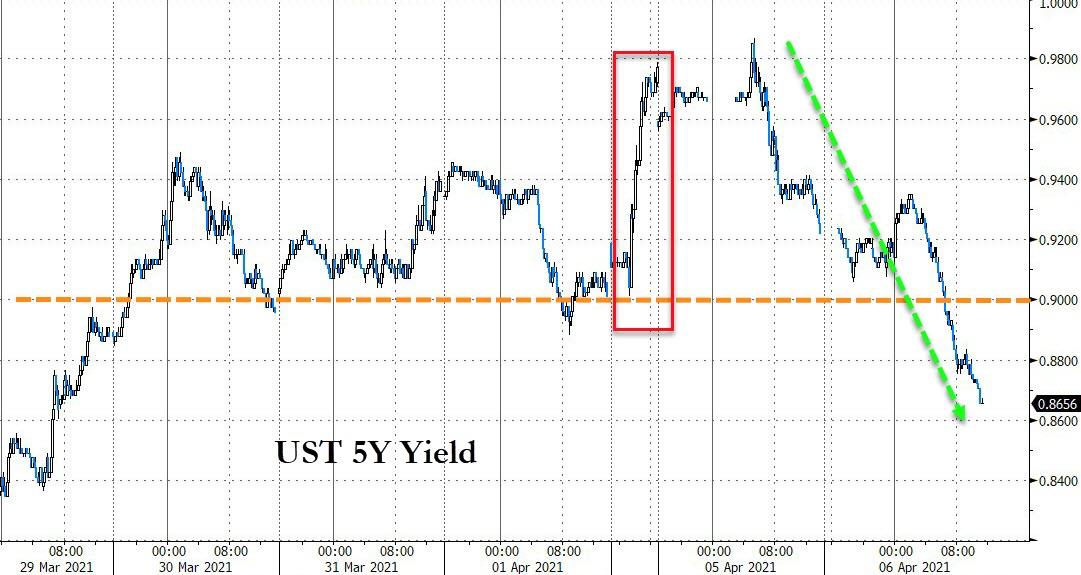
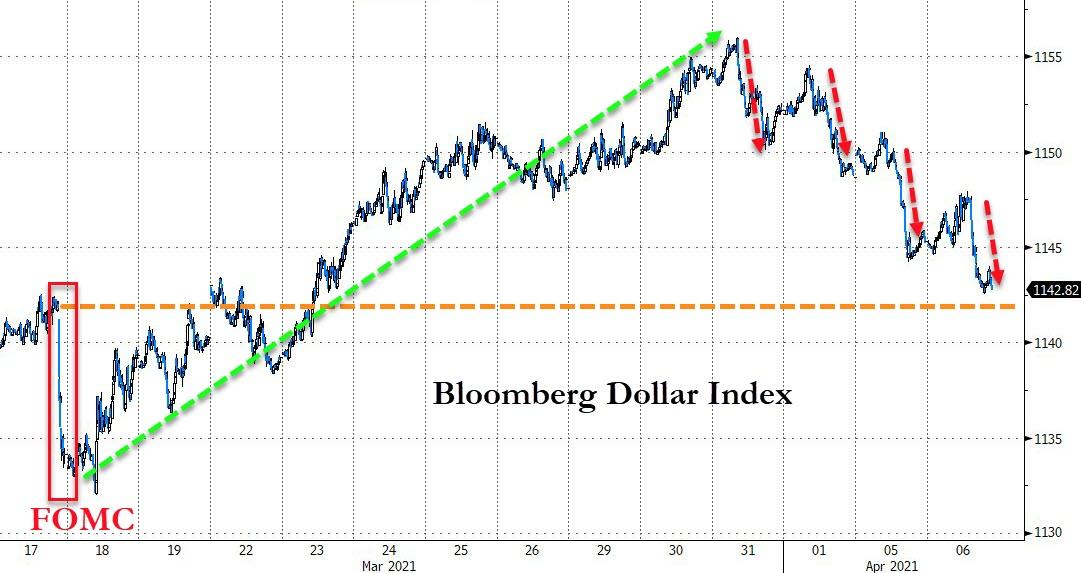
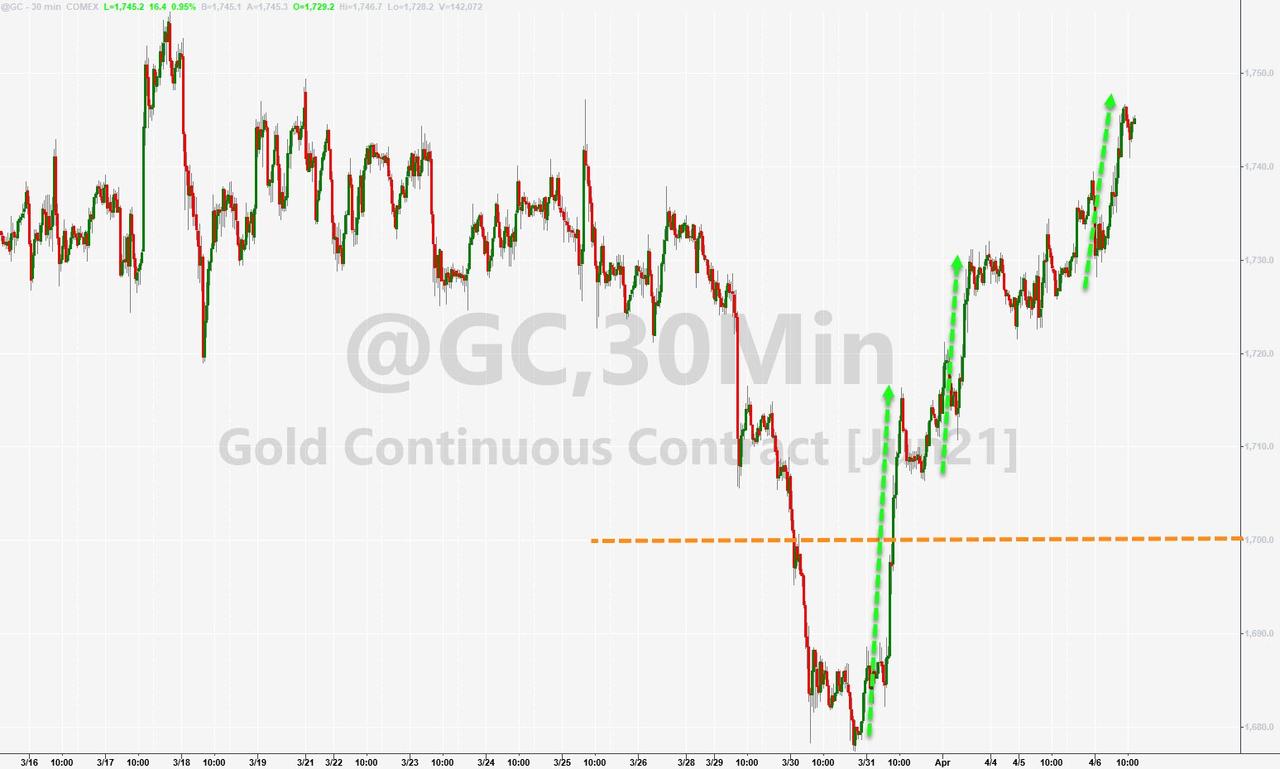
Bond yields continued to ease up with the 5-year dropping below 0.90%, the US Dollar stumbled further, and both helped GLD to rebound with a +0.82% gain.
For sure, the historic stimulus efforts, despite their questionable long-term consequences, have helped equities to regain a solid footing after a wild ride in March. In addition, the vaccination rollout assisted in more businesses opening thereby paving the road for more optimism about the future direction of the markets.
The $2 trillion infrastructure proposal is still subject to much deliberation and pushback, while far from being a certainty in its present form. The size of the bill is still under discussion, as are some of the consequences, namely the impact of an increase in corporate taxes to 28%, along with other yet to be named tax hikes.
In the meantime, Q1 earnings season is on deck with the big banks kicking off the event next week.
2. ETFs in the Spotlight
In case you missed the announcement and description of this section, you can read it here again.
It features some of the 10 broadly diversified domestic and sector ETFs from my HighVolume list as posted every Saturday. Furthermore, they are screened for the lowest MaxDD% number meaning they have been showing better resistance to temporary sell offs than all others over the past year.
The below table simply demonstrates the magnitude with which these ETFs are fluctuating above or below their respective individual trend lines (%+/-M/A). A break below, represented by a negative number, shows weakness, while a break above, represented by a positive percentage, shows strength.
For hundreds of ETF choices, be sure to reference Thursday’s StatSheet.
For this current domestic “Buy” cycle, here’s how some our candidates have fared:

Click image to enlarge.
Again, the %+/-M/A column above shows the position of the various ETFs in relation to their respective long-term trend lines, while the trailing sell stops are being tracked in the “Off High” column. The “Action” column will signal a “Sell” once the -8% point has been taken out in the “Off High” column. For more volatile sector ETFs, the trigger point is -10%.
3. Trend Tracking Indexes (TTIs)
Our TTIs crawled higher, but the overall market mood was one of pausing.
This is how we closed 04/06/2021:
Domestic TTI: +21.13% above its M/A (prior close +20.97%)—Buy signal effective 07/22/2020.
International TTI: +17.79% above its M/A (prior close +17.57%)—Buy signals effective 07/22/2020.
Disclosure: I am obliged to inform you that I, as well as my advisory clients, own some of the ETFs listed in the above table. Furthermore, they do not represent a specific investment recommendation for you, they merely show which ETFs from the universe I track are falling within the specified guidelines.
Contact Ulli