
- Moving the markets
The futures markets already indicated upward equity momentum based on Friday’s jobs report (markets were closed), which generated some 916k jobs in March, was well above the expected 647k, yet it fell short of the 1.8 million whisper number.
In other words, it fell into “goldilocks” territory meaning not too strong and not too weak. That’s all the markets wanted to hear, and the rally was on and did not let up throughout the entire session.
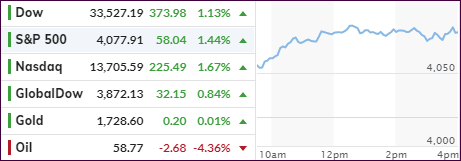
The major indexes closed solidly in the green, led by the tech sector, with the S&P 500 seeing its recently conquered 4k level merely as a vanishing point in the rear-view mirror. The Dow closed at a record high with this bounce in US job growth increasing optimism of a sharp economic recovery.
With the US Services Industry’s activity surging to a record high, voices abound that we are now back in the first innings of a “V-shape” recovery. Of course, that assumes that no more sudden shutdowns are being forced on businesses.
Helping matters was an easing of bond yields with the widely followed 10-year falling to 1.71%.
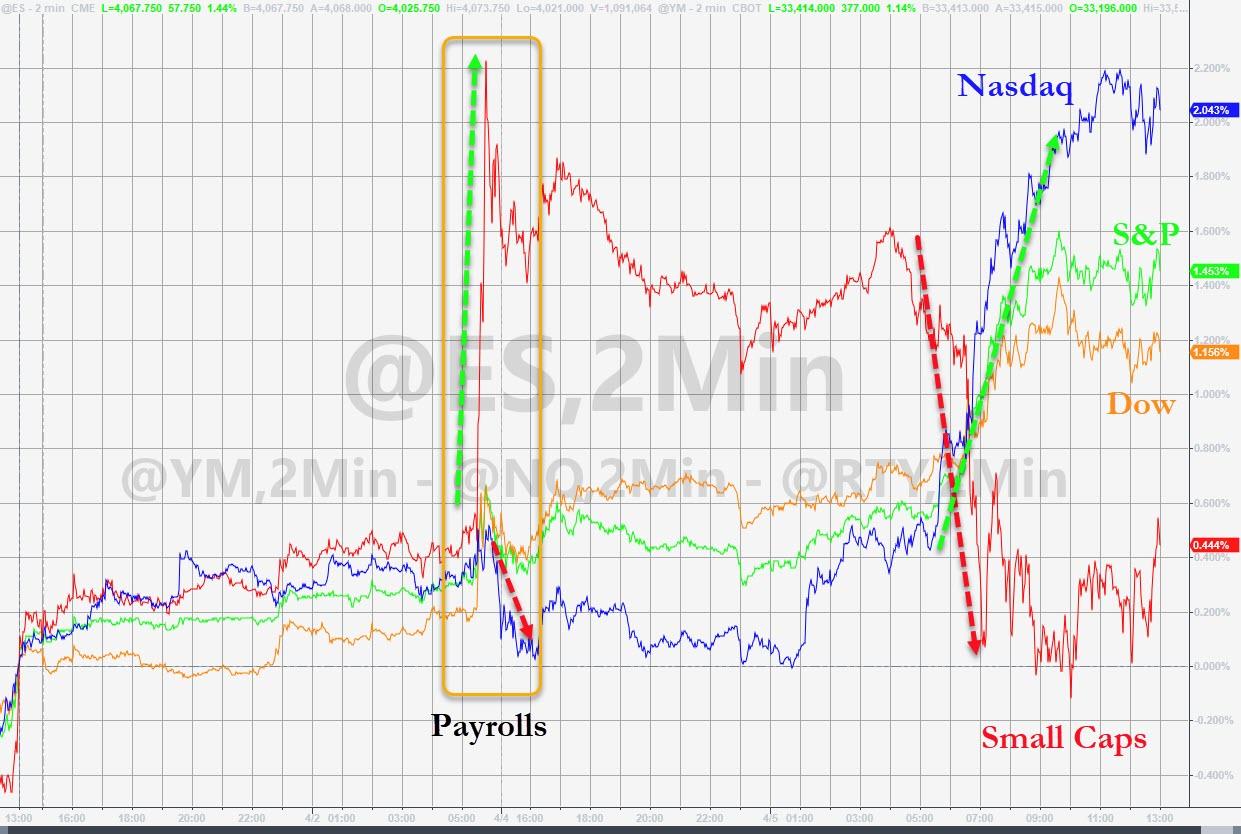
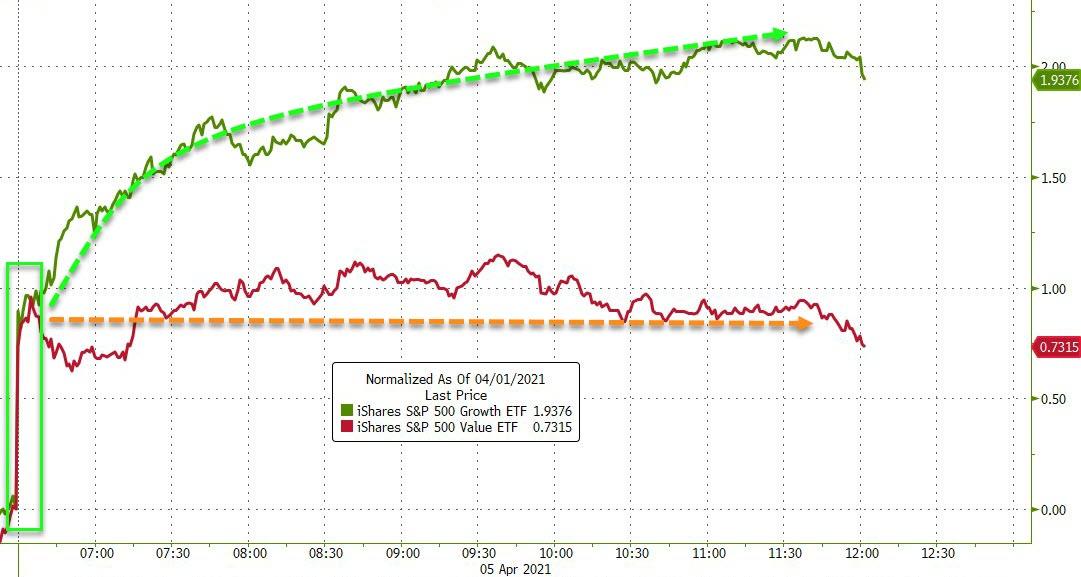
It’s interesting to note that SmallCaps were lagging the major indexes in today’s rally fest and were being outperformed by MidCaps. Leading the pack was the Nasdaq with the QQQs managing a firmly +2% gain, as “growth” outperformed “value” by a wide margin.
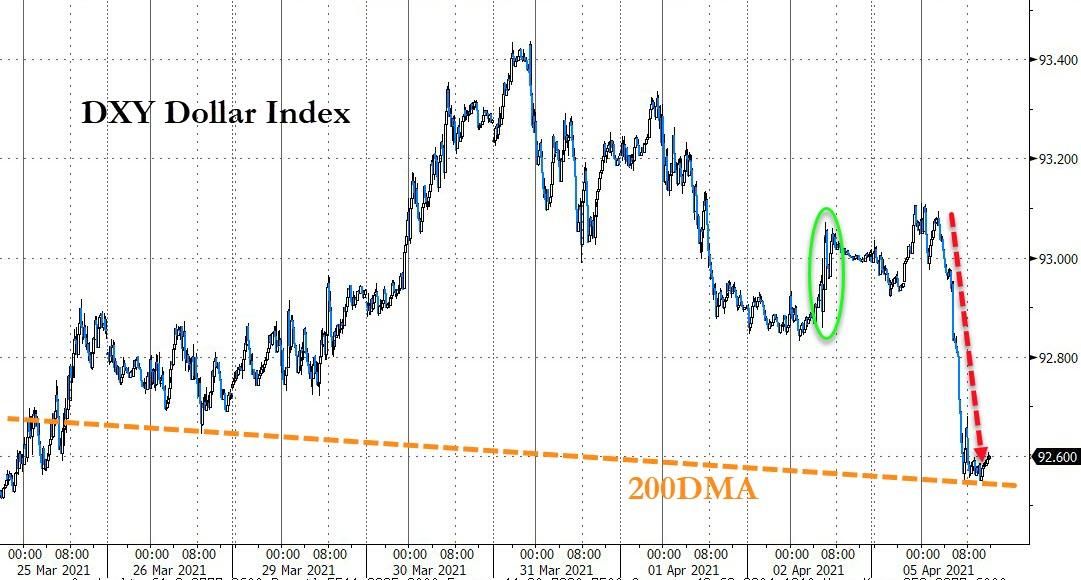
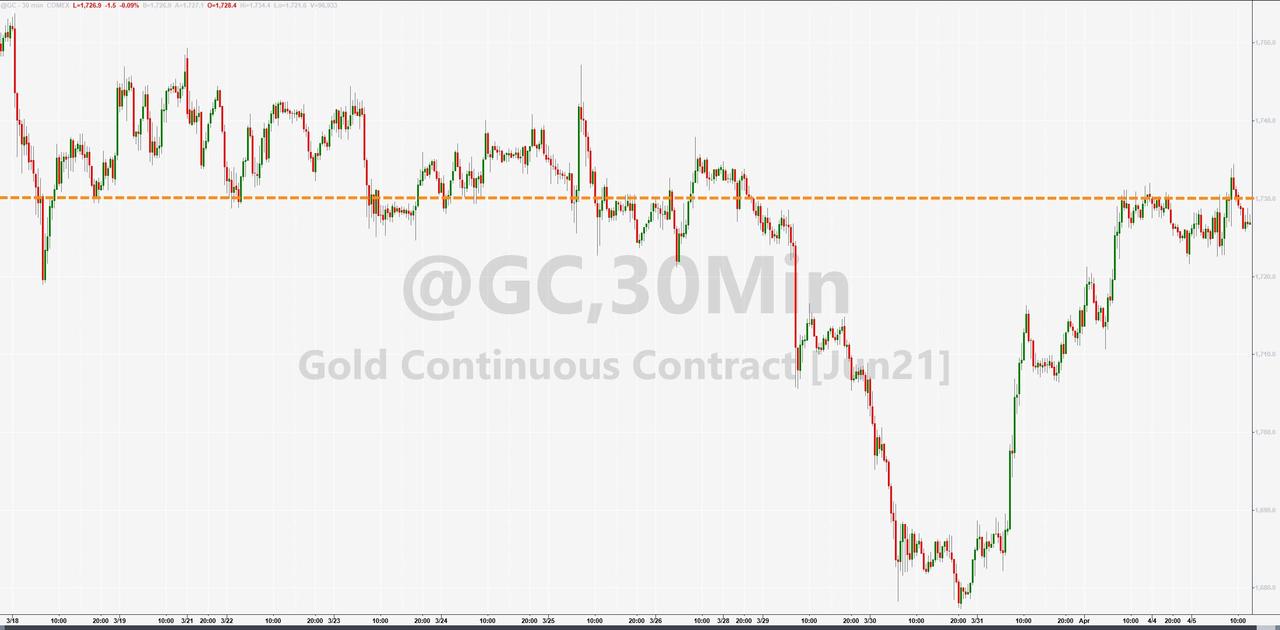
The US Dollar index got hammered all the way back to its 200-day M/A, but this drop was not enough to spark a gold recovery with the precious metal doing nothing but treading water.
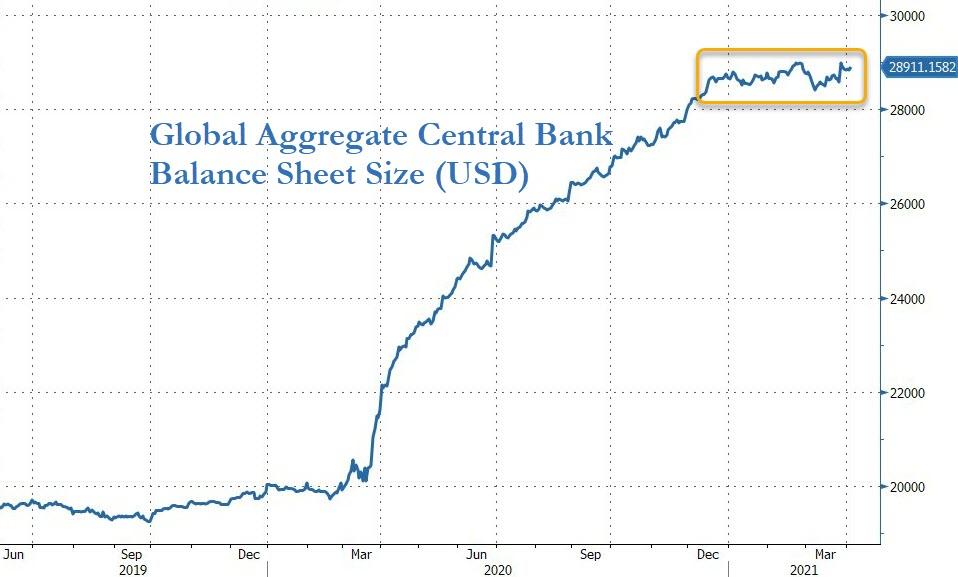
As ZH/Bloomberg pointed out in this chart, the global bank balance sheets have stagnated, and it looks like more ammunition in form of an increase in debt is needed to keep this party going.
2. ETFs in the Spotlight
In case you missed the announcement and description of this section, you can read it here again.
It features some of the 10 broadly diversified domestic and sector ETFs from my HighVolume list as posted every Saturday. Furthermore, they are screened for the lowest MaxDD% number meaning they have been showing better resistance to temporary sell offs than all others over the past year.
The below table simply demonstrates the magnitude with which these ETFs are fluctuating above or below their respective individual trend lines (%+/-M/A). A break below, represented by a negative number, shows weakness, while a break above, represented by a positive percentage, shows strength.
For hundreds of ETF choices, be sure to reference Thursday’s StatSheet.
For this current domestic “Buy” cycle, here’s how some our candidates have fared:
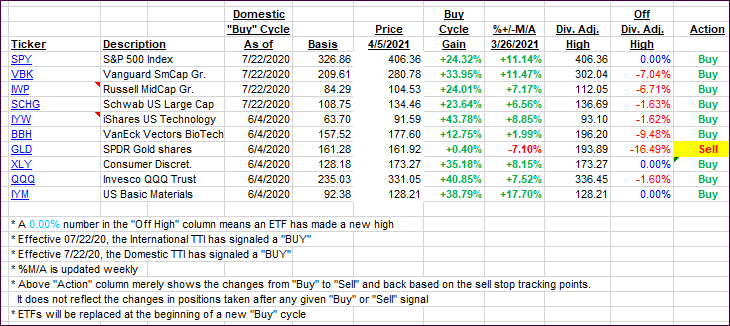
Click image to enlarge.
Again, the %+/-M/A column above shows the position of the various ETFs in relation to their respective long-term trend lines, while the trailing sell stops are being tracked in the “Off High” column. The “Action” column will signal a “Sell” once the -8% point has been taken out in the “Off High” column. For more volatile sector ETFs, the trigger point is -10%.
3. Trend Tracking Indexes (TTIs)
Our TTIs jumped with Friday’s jobs report affecting the markets positively.
This is how we closed 04/05/2021:
Domestic TTI: +20.97% above its M/A (prior close +19.88%)—Buy signal effective 07/22/2020.
International TTI: +17.57% above its M/A (prior close +16.51%)—Buy signals effective 07/22/2020.
Disclosure: I am obliged to inform you that I, as well as my advisory clients, own some of the ETFs listed in the above table. Furthermore, they do not represent a specific investment recommendation for you, they merely show which ETFs from the universe I track are falling within the specified guidelines.
Contact Ulli