
- Moving the markets
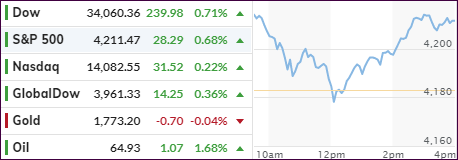
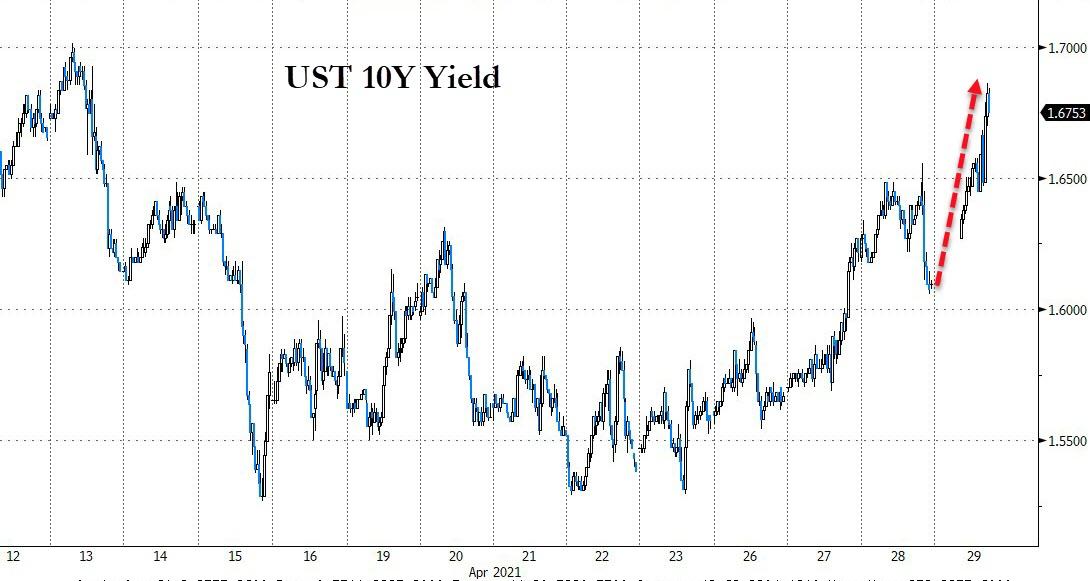
The S&P 500 managed to find some footing, after a mid-day gag caused by surging bond yields, and scored another record close, powered by blowout earnings from the tech sector, namely Apple and Facebook. Despite their solid performances, the Nasdaq lagged the other two major indexes for the day by a wide margin.
On the economic front, we learned that 1st quarter GDP was reported at “only 6.4%,” which missed expectations of 6.6% but, is an improvement to the Q4 number of 4.3% The question that ZeroHedge posted “Is this all the growth that $2 trillion in stimulus can buy?” remains a valid one, and it casts doubt on the effects of future reckless money printing in terms what it can really accomplish.
Pending Home Sales disappointed due to low inventory, while last week’s Initial Jobless Claims totaled 553k, just a tad worse than the 528k estimated by Dow Jones.
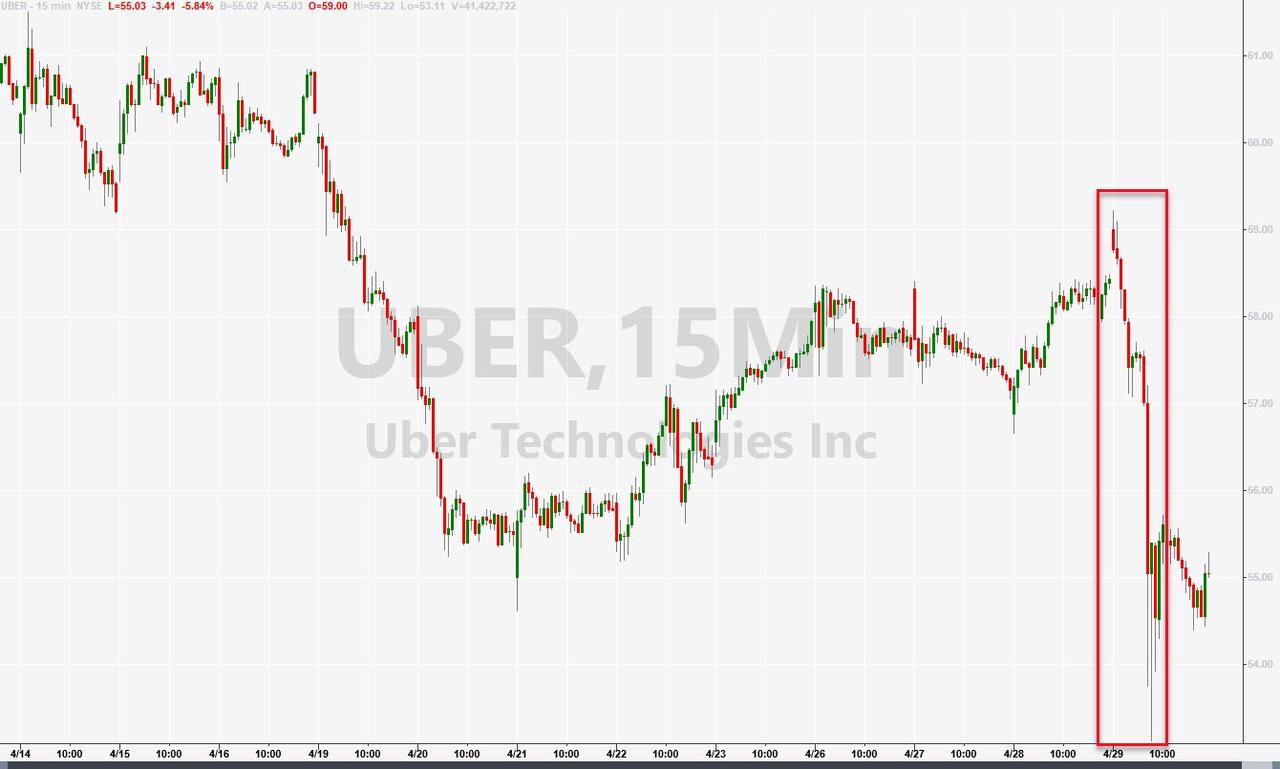
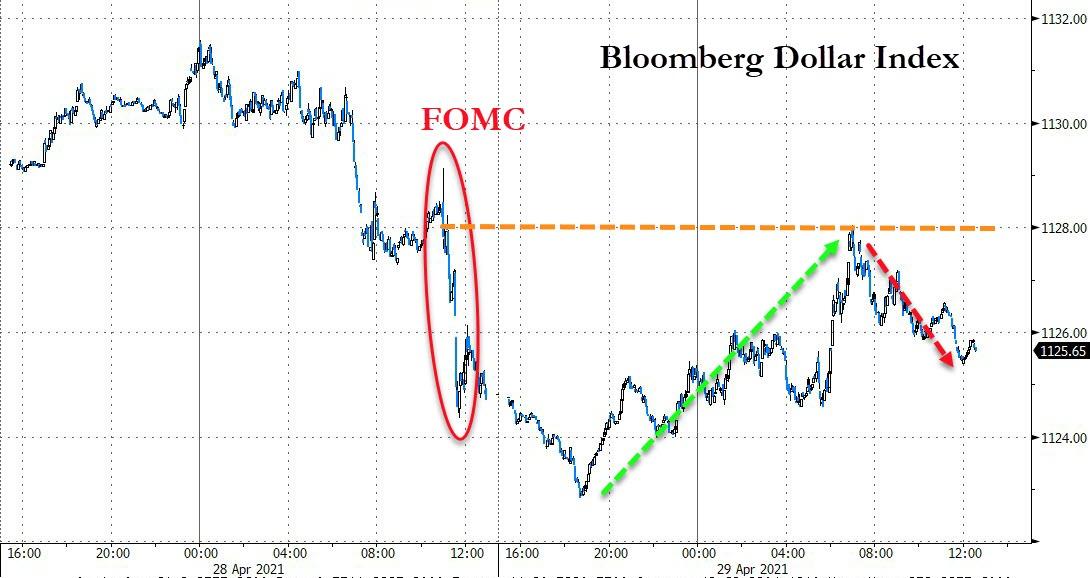
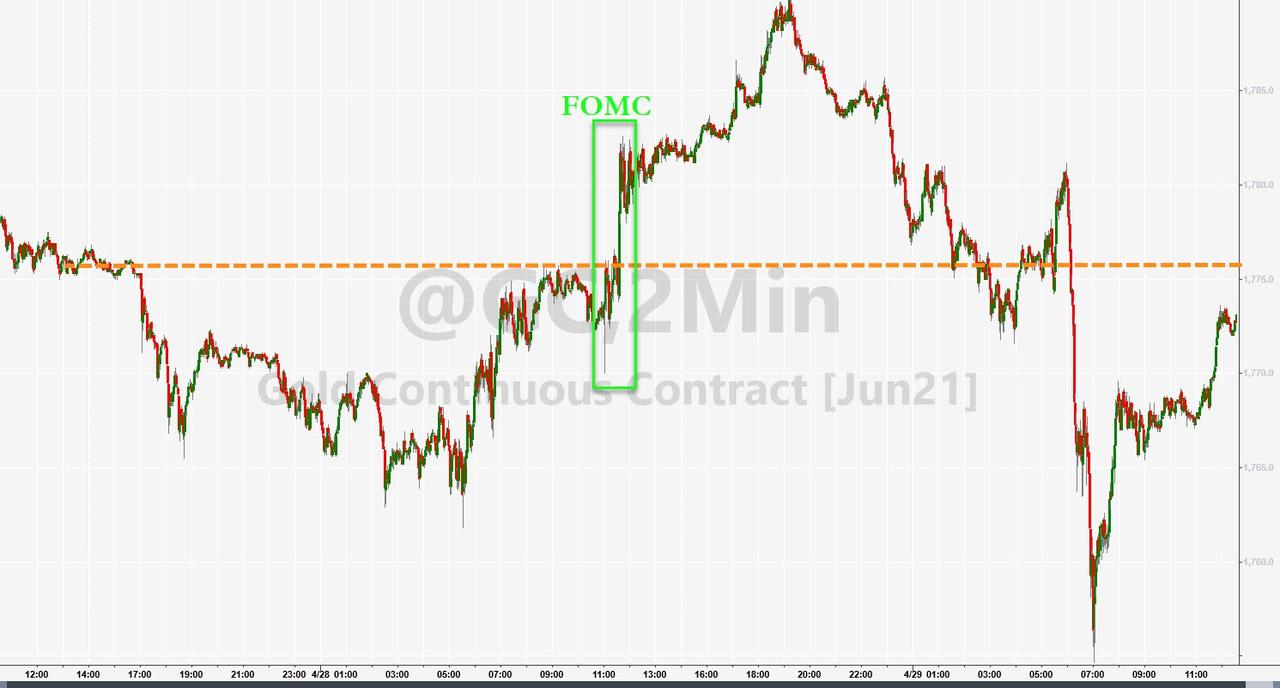
Crowd favorites Uber and Lyft were manhandled today and got battered after Biden’s plan to make gig workers employees. Bond yields rode the roller coaster by popping and dropping as Bloomberg shows in this chart. The US Dollar roundtripped as well, sold off into the close but managed to eke out a gain. Gold followed suit but ended the session flat.
While uncertainty played havoc with the markets intraday, in the end, the bulls managed to keep the upper hand when it counted most, namely at the close.
2. ETFs in the Spotlight
In case you missed the announcement and description of this section, you can read it here again.
It features some of the 10 broadly diversified domestic and sector ETFs from my HighVolume list as posted every Saturday. Furthermore, they are screened for the lowest MaxDD% number meaning they have been showing better resistance to temporary sell offs than all others over the past year.
The below table simply demonstrates the magnitude with which these ETFs are fluctuating above or below their respective individual trend lines (%+/-M/A). A break below, represented by a negative number, shows weakness, while a break above, represented by a positive percentage, shows strength.
For hundreds of ETF choices, be sure to reference Thursday’s StatSheet.
For this current domestic “Buy” cycle, here’s how some our candidates have fared:
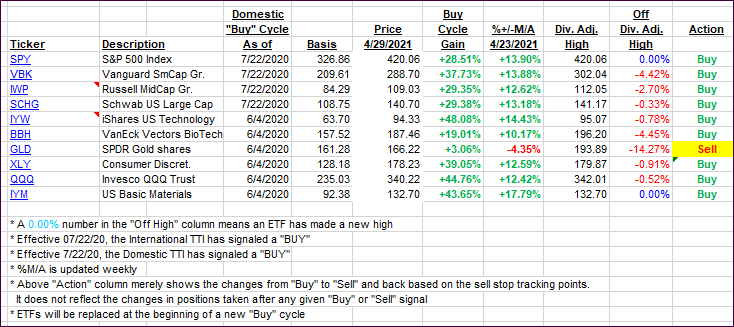
Click image to enlarge.
Again, the %+/-M/A column above shows the position of the various ETFs in relation to their respective long-term trend lines, while the trailing sell stops are being tracked in the “Off High” column. The “Action” column will signal a “Sell” once the -8% point has been taken out in the “Off High” column. For more volatile sector ETFs, the trigger point is -10%.
3. Trend Tracking Indexes (TTIs)
Our TTIs edged north by small margin as the major indexes gained moderately.
This is how we closed 4/29/2021:
Domestic TTI: +20.68% above its M/A (prior close +19.89%)—Buy signal effective 07/22/2020.
International TTI: +16.72% above its M/A (prior close +16.46%)—Buy signals effective 07/22/2020.
Disclosure: I am obliged to inform you that I, as well as my advisory clients, own some of the ETFs listed in the above table. Furthermore, they do not represent a specific investment recommendation for you, they merely show which ETFs from the universe I track are falling within the specified guidelines.
Contact Ulli