
- Moving the markets
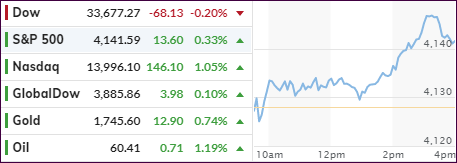
Despite a slow start, the S&P 500 and Nasdaq found some upward momentum late in the session and broke out of a sideways trend with the former scoring a new all-time high.
Anxiety about the Consumer Price Index (CPI) faded with the index rising in March by 0.6% vs. 0.5% expectations. YoY we saw a 2.6% increase, which also was a tad higher than expectations of 2.5%. Overall, traders were relieved that the outcome was not as bad as feared.
Also keeping a lid on prices early on was news that the rollout of Johnson & Johnson vaccine was halted, which kept trading activity on a subdued level. The reason for the pause were investigations of six reported cases of a rare and severe type of blood clot, the FDA stated.
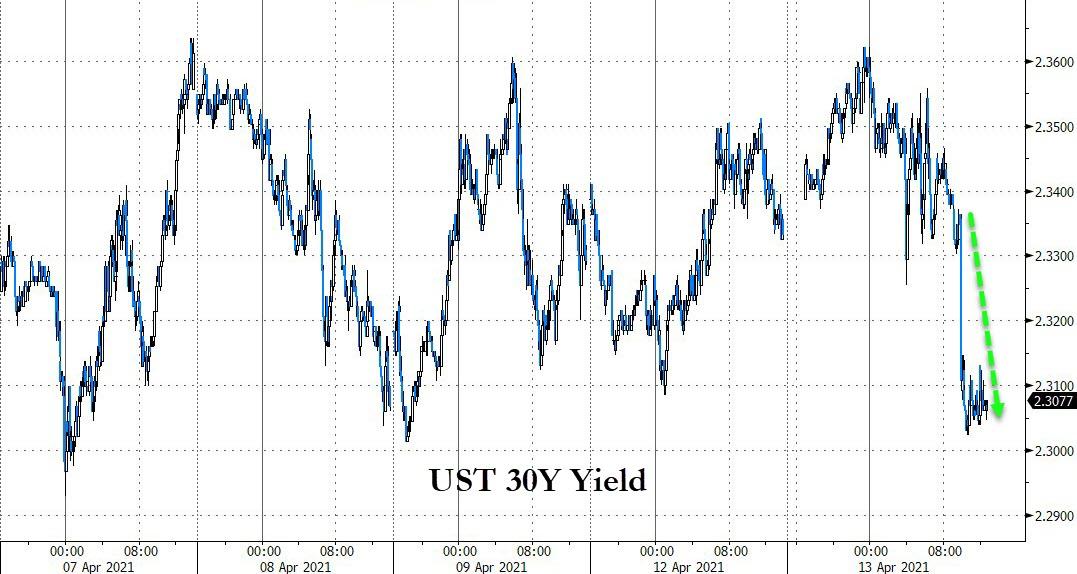
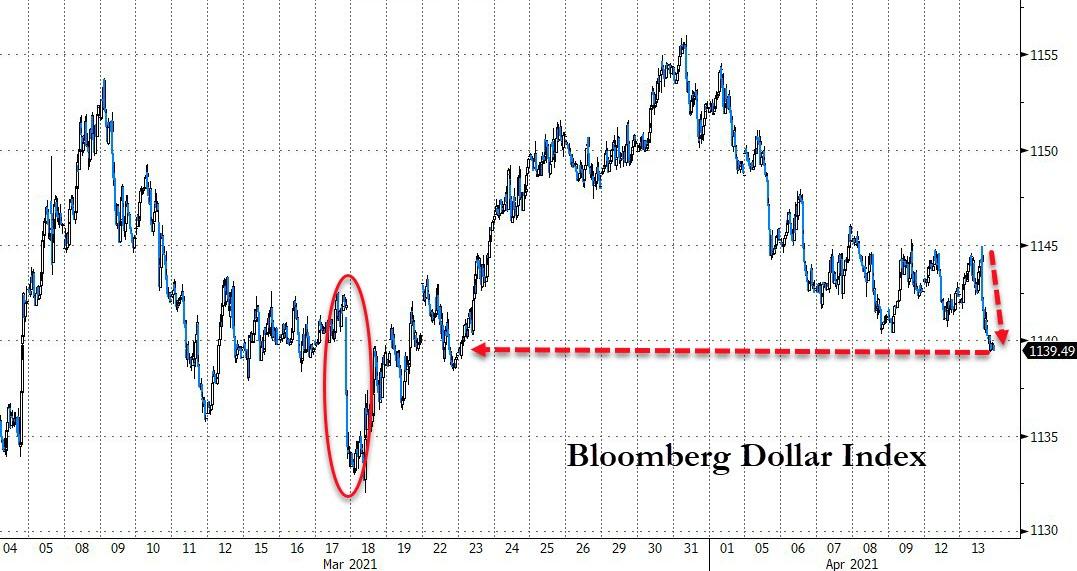
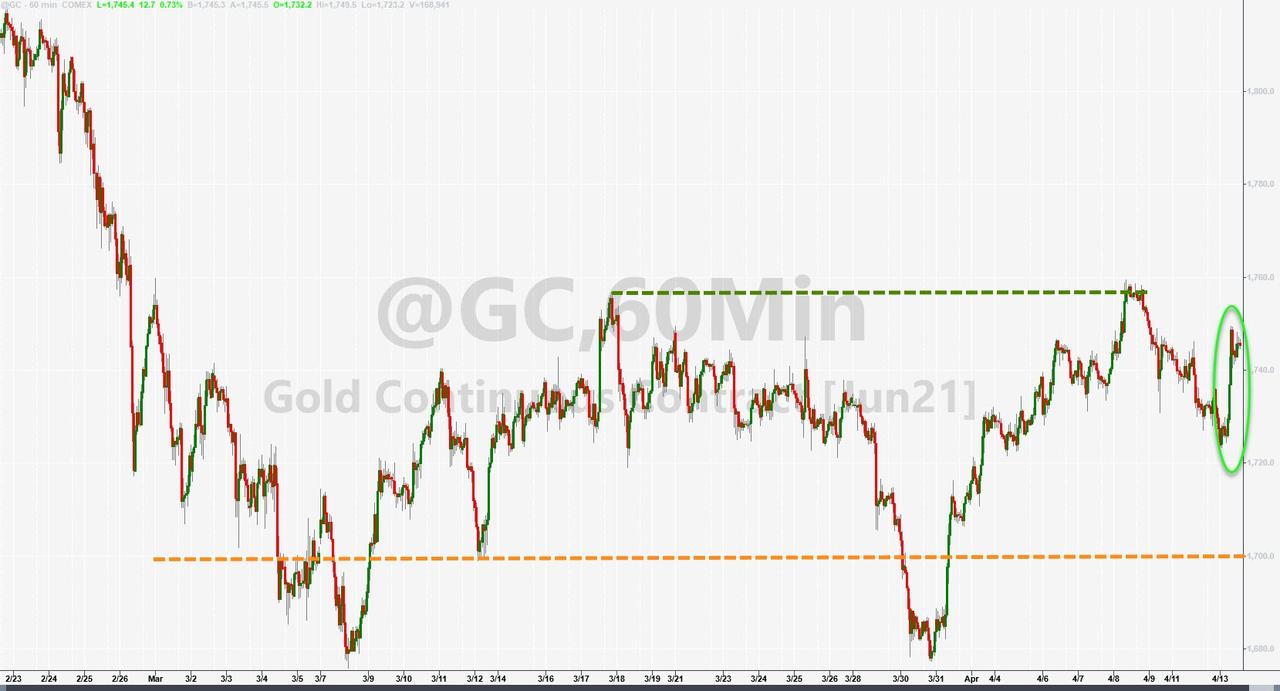
The volatility index (VIX) continued to crawl sideways and has now closed below 20 for 10 straight days, something that has not happened since February 2020, according to ZH. Bonds were bid, meaning yields drifted lower, as did the US Dollar, which allowed gold to have a day with a green close and a gain of 0.74%.
Here’s another record that ZH pointed to, namely that the S&P 500 ETF (SPY) has now closed above its opening price for the 13th day in a row. Since the SPY’s inception in 1993, this has never happened before.
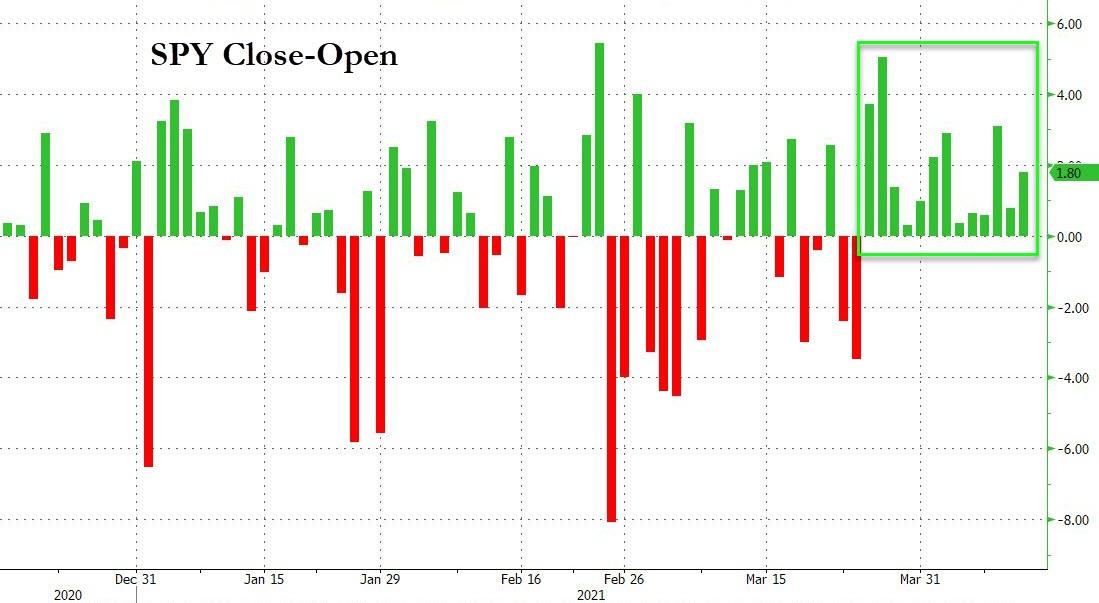
This makes me go “hmm.” Could market manipulation possibly have something to do with it?
2. ETFs in the Spotlight
In case you missed the announcement and description of this section, you can read it here again.
It features some of the 10 broadly diversified domestic and sector ETFs from my HighVolume list as posted every Saturday. Furthermore, they are screened for the lowest MaxDD% number meaning they have been showing better resistance to temporary sell offs than all others over the past year.
The below table simply demonstrates the magnitude with which these ETFs are fluctuating above or below their respective individual trend lines (%+/-M/A). A break below, represented by a negative number, shows weakness, while a break above, represented by a positive percentage, shows strength.
For hundreds of ETF choices, be sure to reference Thursday’s StatSheet.
For this current domestic “Buy” cycle, here’s how some our candidates have fared:
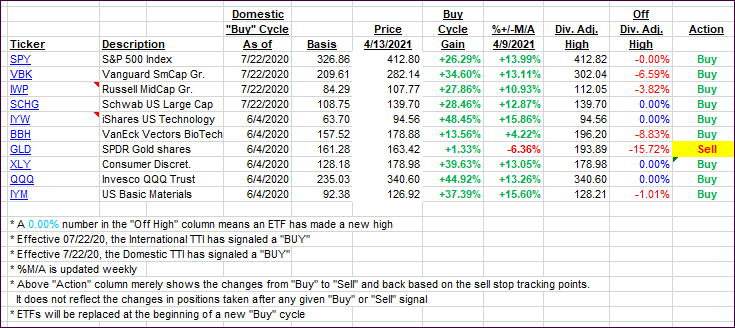
Click image to enlarge.
Again, the %+/-M/A column above shows the position of the various ETFs in relation to their respective long-term trend lines, while the trailing sell stops are being tracked in the “Off High” column. The “Action” column will signal a “Sell” once the -8% point has been taken out in the “Off High” column. For more volatile sector ETFs, the trigger point is -10%.
3. Trend Tracking Indexes (TTIs)
Our TTIs closed mixed again with the Domestic one slipping and the International one adding a fraction.
This is how we closed 4/13/2021:
Domestic TTI: +19.38% above its M/A (prior close +19.59%)—Buy signal effective 07/22/2020.
International TTI: +16.20% above its M/A (prior close +16.07%)—Buy signals effective 07/22/2020.
Disclosure: I am obliged to inform you that I, as well as my advisory clients, own some of the ETFs listed in the above table. Furthermore, they do not represent a specific investment recommendation for you, they merely show which ETFs from the universe I track are falling within the specified guidelines.
Contact Ulli