
- Moving the markets
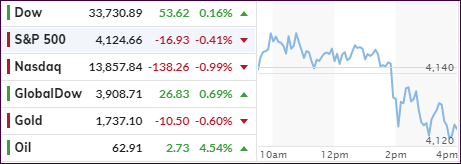
After an early pump, the major indexes lost momentum with the S&P 500 and Nasdaq ending up in the red, while the Dow managed to stay above its unchanged line.
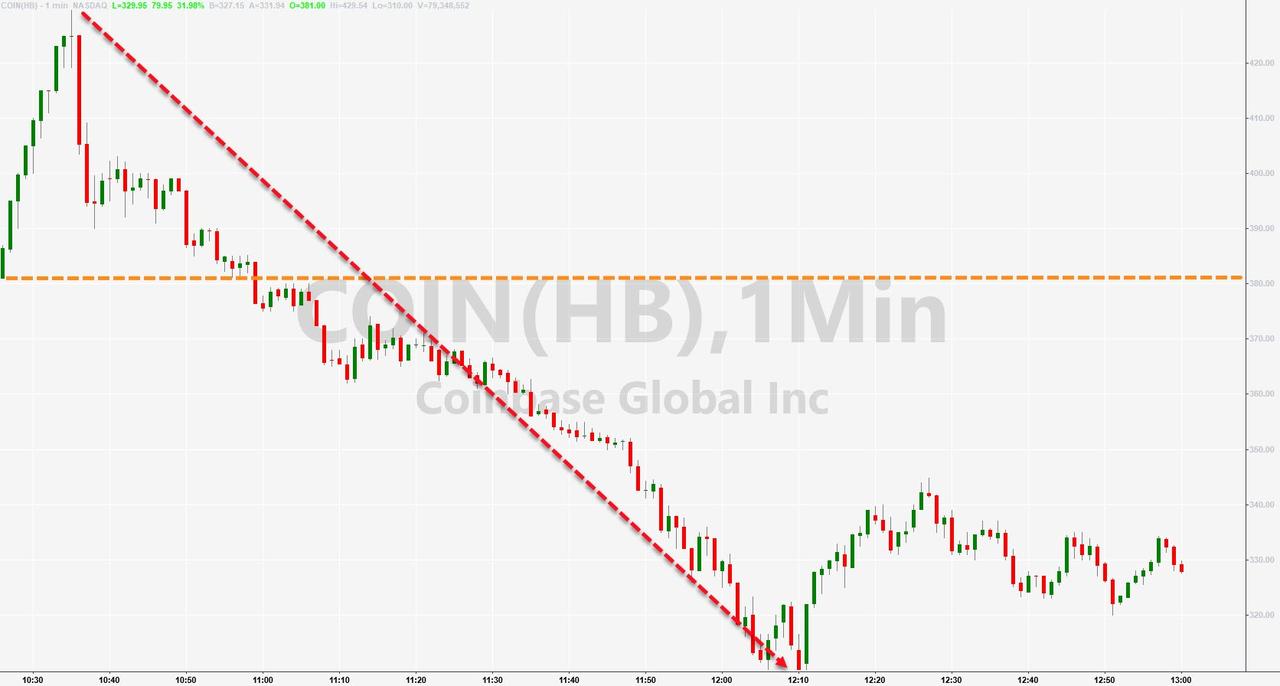
Strong bank earnings helped the financial sector with XLF gaining +0.63%, but that was offset by tech stocks tanking, despite the widely anticipated IPO of Coinbase. The stock rallied at first but then most momentum and closed below its IPO price.
Added the chief strategist of TD Ameritrade:
The first wave of Q1 big bank results look pretty much as strong as most analysts had expected – even stronger actually, it’s possible that we’re in a powerful market that’s in a forgiving mood when it comes to bad news. The path of least resistance for stocks continues to seem to be to go higher, with the market climbing a wall of worries that just doesn’t go away.
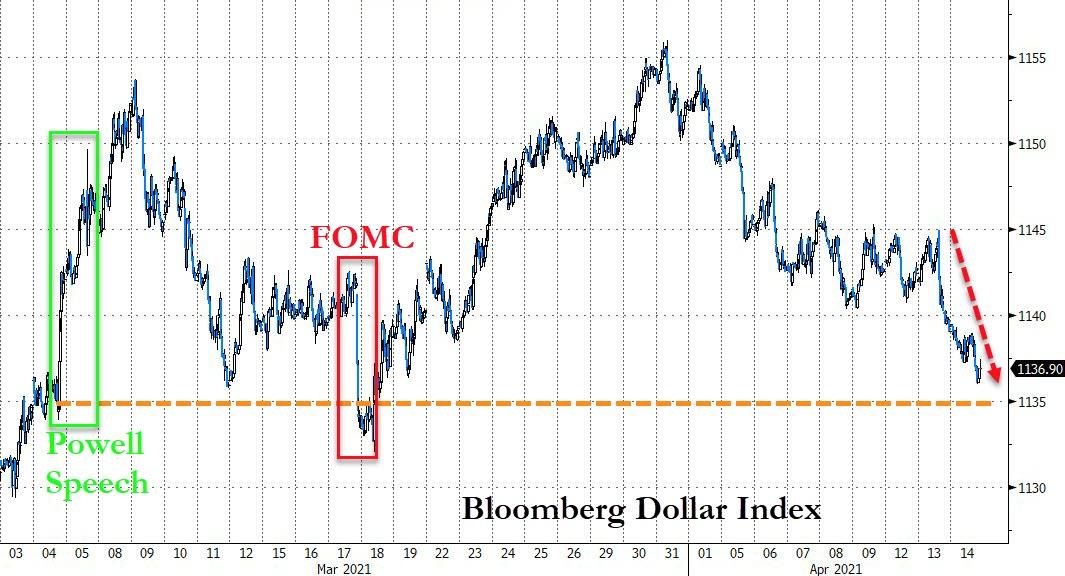
On the economic front, we learned that soaring import and export price inflation has finally been noted with the Commodity ETF DBC rocketing +2.30%. None of this was addressed by Fed head Powell speaking before the Economic Club of Washington.
The US Dollar took a dive and approached a key support level, bond yields inched up a bit, and Gold gave back some of yesterday’s gains.
Another session where not much was gained or lost.
2. ETFs in the Spotlight
In case you missed the announcement and description of this section, you can read it here again.
It features some of the 10 broadly diversified domestic and sector ETFs from my HighVolume list as posted every Saturday. Furthermore, they are screened for the lowest MaxDD% number meaning they have been showing better resistance to temporary sell offs than all others over the past year.
The below table simply demonstrates the magnitude with which these ETFs are fluctuating above or below their respective individual trend lines (%+/-M/A). A break below, represented by a negative number, shows weakness, while a break above, represented by a positive percentage, shows strength.
For hundreds of ETF choices, be sure to reference Thursday’s StatSheet.
For this current domestic “Buy” cycle, here’s how some our candidates have fared:

Click image to enlarge.
Again, the %+/-M/A column above shows the position of the various ETFs in relation to their respective long-term trend lines, while the trailing sell stops are being tracked in the “Off High” column. The “Action” column will signal a “Sell” once the -8% point has been taken out in the “Off High” column. For more volatile sector ETFs, the trigger point is -10%.
3. Trend Tracking Indexes (TTIs)
Our TTIs changed only inconsequentially.
This is how we closed 4/14/2021:
Domestic TTI: +19.57% above its M/A (prior close +19.38%)—Buy signal effective 07/22/2020.
International TTI: +16.88% above its M/A (prior close +16.20%)—Buy signals effective 07/22/2020.
Disclosure: I am obliged to inform you that I, as well as my advisory clients, own some of the ETFs listed in the above table. Furthermore, they do not represent a specific investment recommendation for you, they merely show which ETFs from the universe I track are falling within the specified guidelines.
Contact Ulli