
- Moving the markets
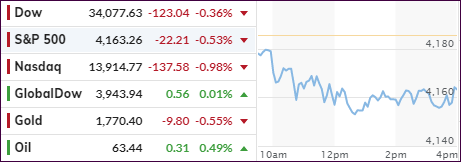
The major indexes started the week in the red and stayed there throughout the session, as it appeared that traders had lost their appetite and any buying motivation. Weakness in the tech sector did not help and, given the fact that the Dow and S&P 500 just scored new highs on Friday, it comes as no surprise that a pause was in order.
Banks were lower due to profit taking after last week’s positive earnings fest with the financial sector, as represented by XLF, giving back a modest 0.28%. Overall, the pullback was fairly small, yet broad, as there were no winners, other than the commodity index (DBC), which managed a green close by adding +0.23%.
We saw no economic data releases and therefore no motivator of any kind to get the bullish juices flowing. ZH concluded that “it seems that investors just didn’t like Monday.”
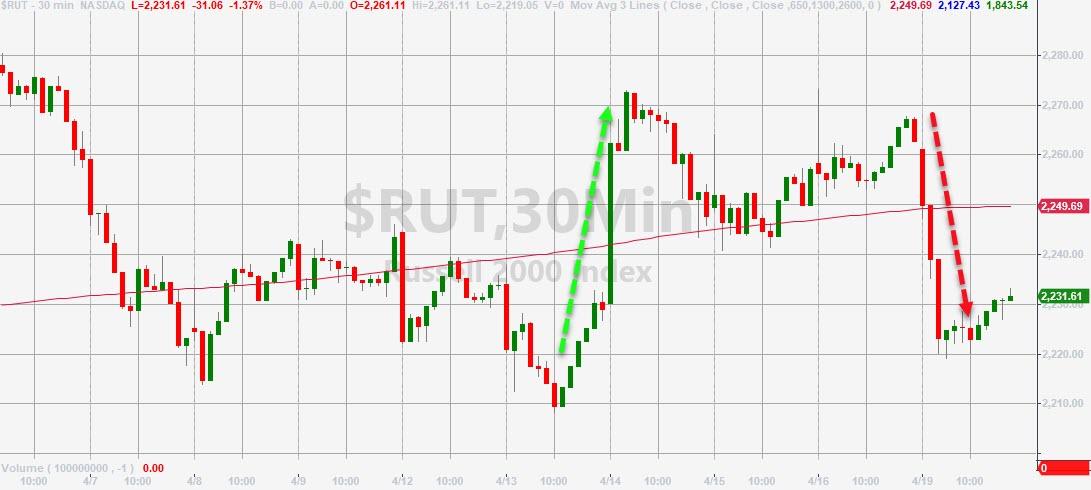
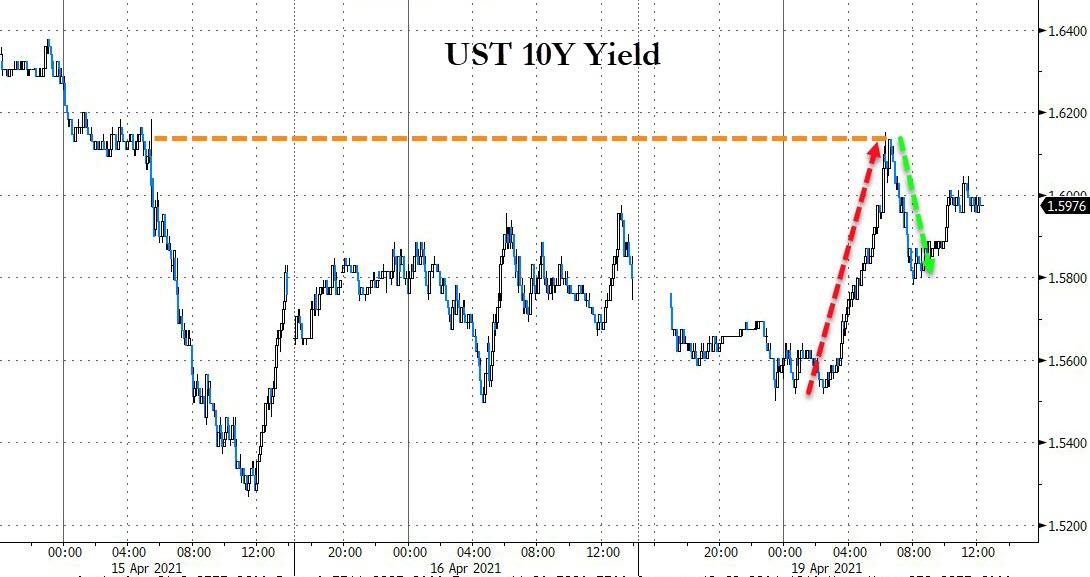
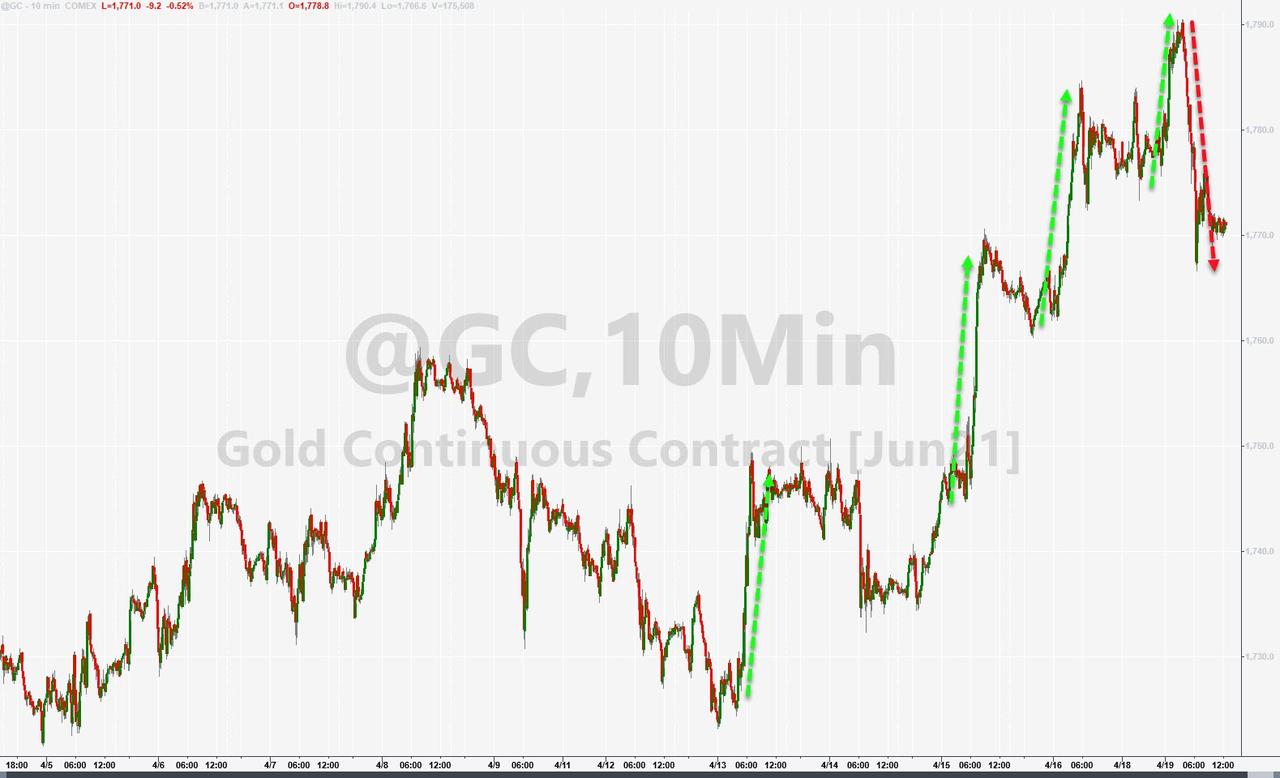
SmallCaps were the worst performers and just broke below their 50-day M/A, as ZH pointed out. Bond yields dropped, and the US Dollar continued its slide, but neither event could save gold from slipping off its overnight highs.
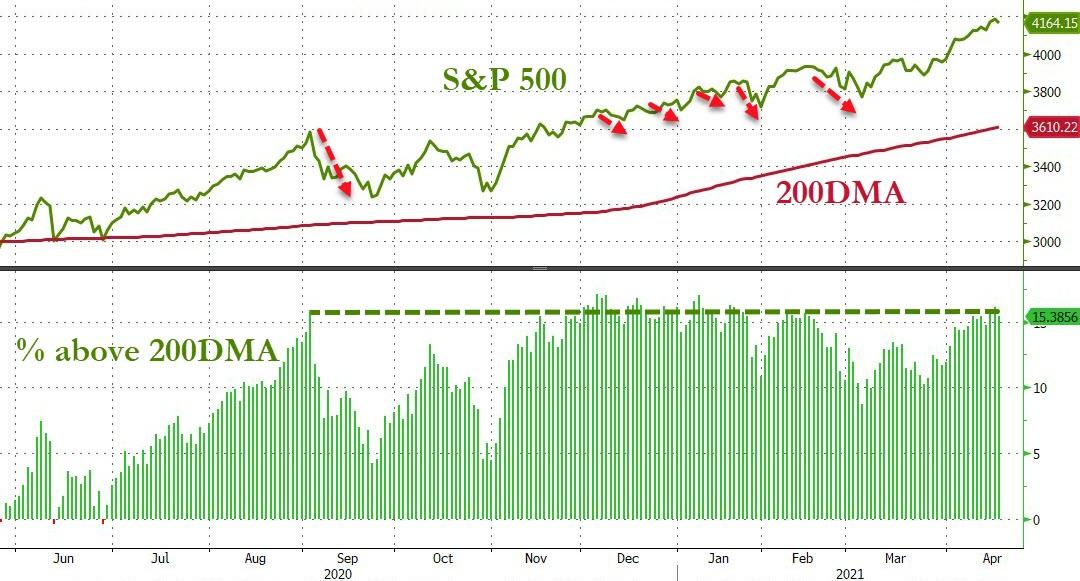
Noted ZH: The S&P 500 is now 15% above its 200-day M/A, a level that in the past has marked a turning point.
Will history rhyme again?
2. ETFs in the Spotlight
In case you missed the announcement and description of this section, you can read it here again.
It features some of the 10 broadly diversified domestic and sector ETFs from my HighVolume list as posted every Saturday. Furthermore, they are screened for the lowest MaxDD% number meaning they have been showing better resistance to temporary sell offs than all others over the past year.
The below table simply demonstrates the magnitude with which these ETFs are fluctuating above or below their respective individual trend lines (%+/-M/A). A break below, represented by a negative number, shows weakness, while a break above, represented by a positive percentage, shows strength.
For hundreds of ETF choices, be sure to reference Thursday’s StatSheet.
For this current domestic “Buy” cycle, here’s how some our candidates have fared:
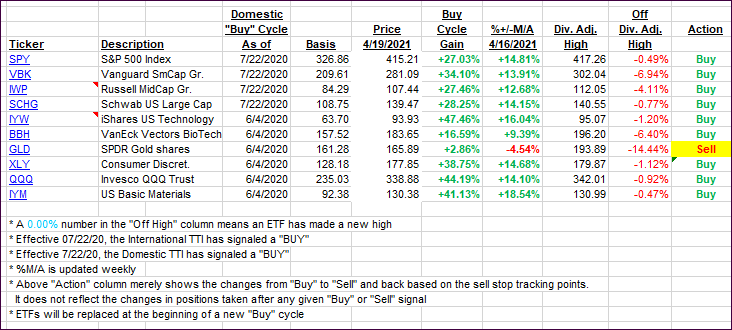
Click image to enlarge.
Again, the %+/-M/A column above shows the position of the various ETFs in relation to their respective long-term trend lines, while the trailing sell stops are being tracked in the “Off High” column. The “Action” column will signal a “Sell” once the -8% point has been taken out in the “Off High” column. For more volatile sector ETFs, the trigger point is -10%.
3. Trend Tracking Indexes (TTIs)
Our TTIs barely moved, but the Domestic one slipped a tad.
This is how we closed 4/19/2021:
Domestic TTI: +19.40% above its M/A (prior close +19.97%)—Buy signal effective 07/22/2020.
International TTI: +17.05% above its M/A (prior close +17.05%)—Buy signals effective 07/22/2020.
Disclosure: I am obliged to inform you that I, as well as my advisory clients, own some of the ETFs listed in the above table. Furthermore, they do not represent a specific investment recommendation for you, they merely show which ETFs from the universe I track are falling within the specified guidelines.
Contact Ulli