
- Moving the markets
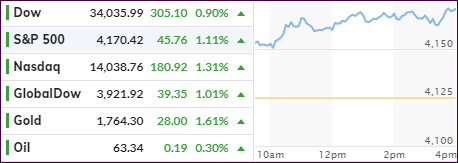
The unchanged line was nowhere near in sight, as the major indexes roared higher after the opening bell and never looked back with the Dow and S&P 500 reaching new all-time highs. Big tech surged and maintained their dominance over SmallCaps, while “growth” outperformed “value.”
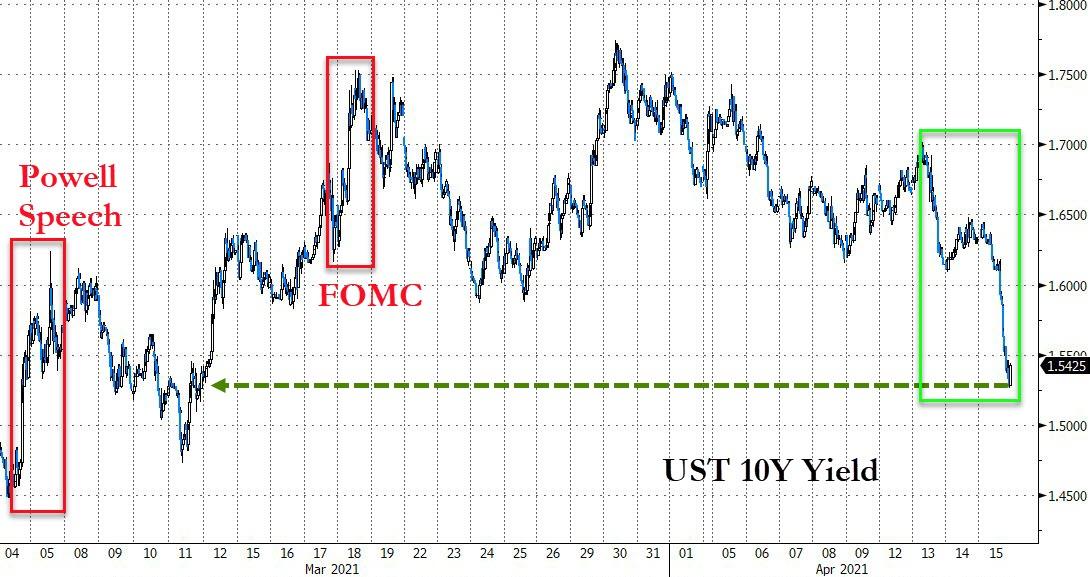
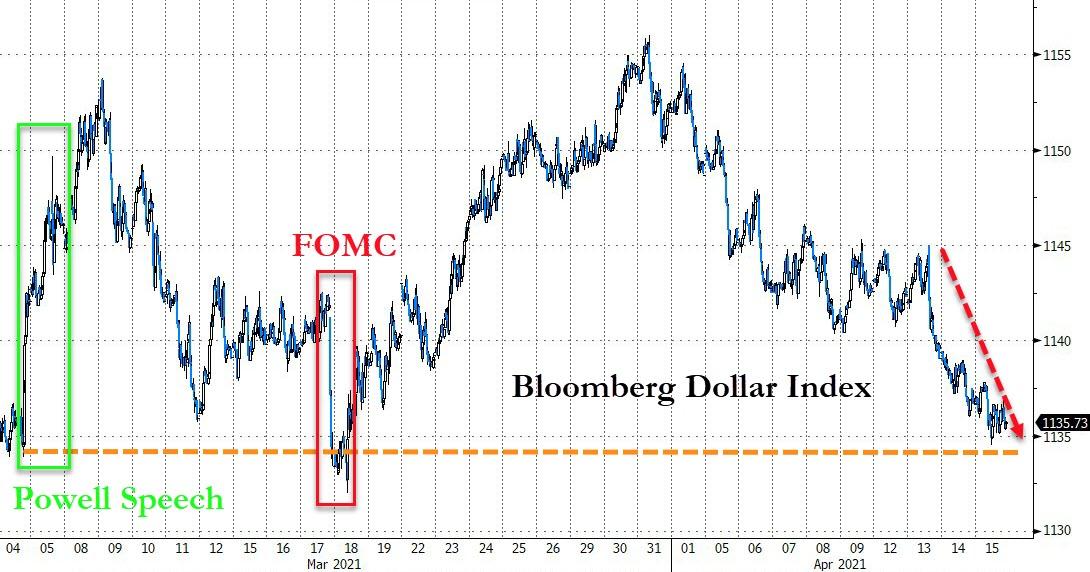
Strong earnings and some economic reports painted a rosy picture for consumer spending and the jobs market. Bond yields dropped with the 10-year sliding to 1.56%, although the US Dollar index trod water.
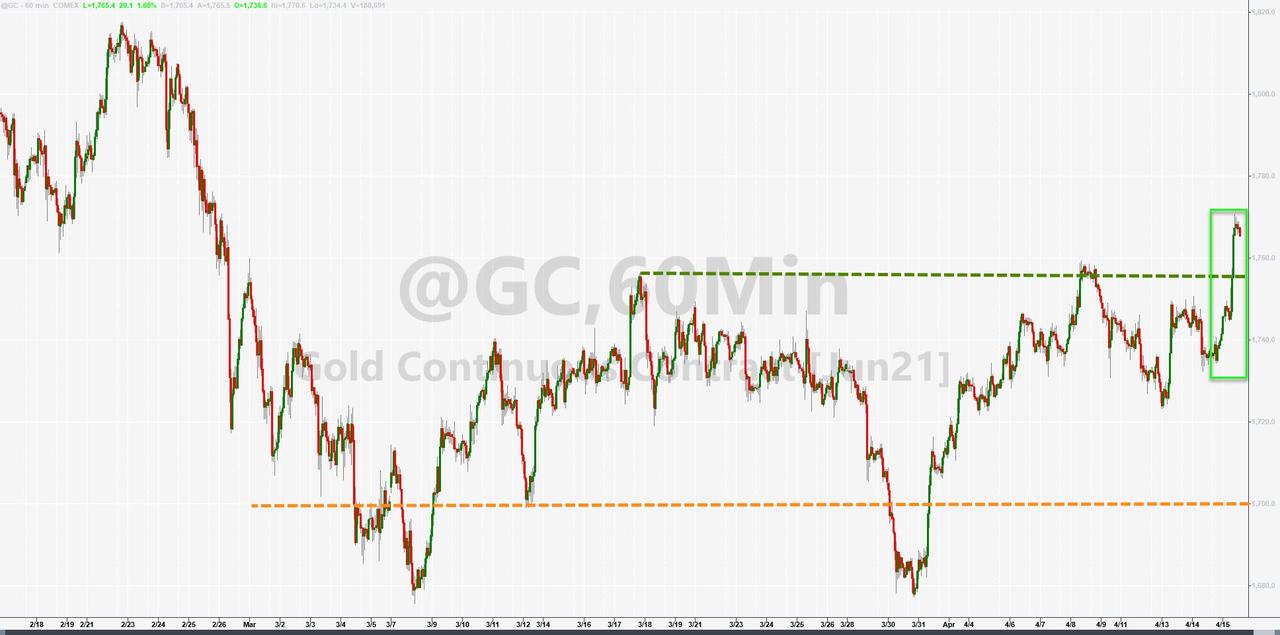
Not just were stocks the beneficiary of the bullish theme, because of lower yields, Gold had its day in the sun and finally rocketed higher by 1.68%, while nearing two-month highs and outperforming even the Nasdaq
Much ado was made about the headline announcing that initial jobless claims dropped back below 600k for the first time since early March 2020. But, as ZH pointed out, this may have been an aberration:
Notably, the drop in claims was largely driven by a 75,645 drop in California… which, as Joe Brusuelas suggests, is indicative of the problems that remain in processing claims, backlogs, and fraud in the states.
Ah yes, the devil is always in the details…
Black Rock’s CEO Larry Fink described the current scenario like this:
I am incredibly bullish on the markets, and you are right to be worried about our deficits. If we don’t have economic growth that is sustainable over the next 10 years — our deficits are going to matter, and they are going to elevate interest rates … I believe because of monetary stimulus, fiscal stimulus, cash on the sidelines, earnings, markets are okay. Markets are going to continue to be stronger.
Optimism despite deficits and consumer inflation, but for right now traders’ minds are noticing nothing but bullish momentum.
2. ETFs in the Spotlight
In case you missed the announcement and description of this section, you can read it here again.
It features some of the 10 broadly diversified domestic and sector ETFs from my HighVolume list as posted every Saturday. Furthermore, they are screened for the lowest MaxDD% number meaning they have been showing better resistance to temporary sell offs than all others over the past year.
The below table simply demonstrates the magnitude with which these ETFs are fluctuating above or below their respective individual trend lines (%+/-M/A). A break below, represented by a negative number, shows weakness, while a break above, represented by a positive percentage, shows strength.
For hundreds of ETF choices, be sure to reference Thursday’s StatSheet.
For this current domestic “Buy” cycle, here’s how some our candidates have fared:

Click image to enlarge.
Again, the %+/-M/A column above shows the position of the various ETFs in relation to their respective long-term trend lines, while the trailing sell stops are being tracked in the “Off High” column. The “Action” column will signal a “Sell” once the -8% point has been taken out in the “Off High” column. For more volatile sector ETFs, the trigger point is -10%.
3. Trend Tracking Indexes (TTIs)
Our TTIs jumped as today’s rally poshed all indexes higher.
This is how we closed 4/15/2021:
Domestic TTI: +20.51% above its M/A (prior close +19.57%)—Buy signal effective 07/22/2020.
International TTI: +17.28% above its M/A (prior close +16.88%)—Buy signals effective 07/22/2020.
Disclosure: I am obliged to inform you that I, as well as my advisory clients, own some of the ETFs listed in the above table. Furthermore, they do not represent a specific investment recommendation for you, they merely show which ETFs from the universe I track are falling within the specified guidelines.
Contact Ulli