
- Moving the markets
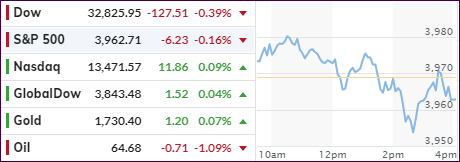
“Uninspiring” best describes today’s session during which we saw the Nasdaq storming ahead of the other 2 major indexes by sporting early gains of more than 1%. Mid-day, the positive vibes stopped, and the Nasdaq suddenly plunged into the red but managed to crawl out of that hole and slightly into the green.
The Dow spent the entire day below its unchanged line, while the S&P 500 vacillated aimlessly without making any headway; in other words much ado about nothing.
Not helping the markets was JP Morgan’s downgrade of SmallCaps, which pulled all of them, the growth- and the value kind, off their recent highs after announcing a “tougher road ahead for that arena,” citing that “their extraordinary performance is coming to an end.”
While that is not a sure thing, at least for today all of them dipped into the red.
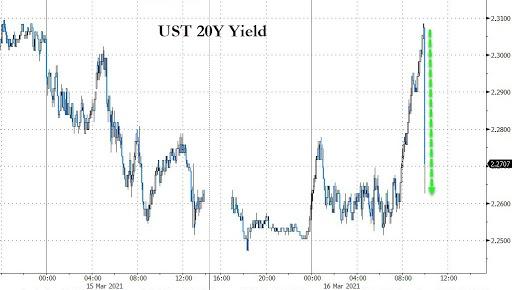
Things went haywire in bond land as well when, after an impressive 20-year auction, the yield suddenly plunged leaving most analysts scratching their head and looking for an explanation—but unable to come up with one.
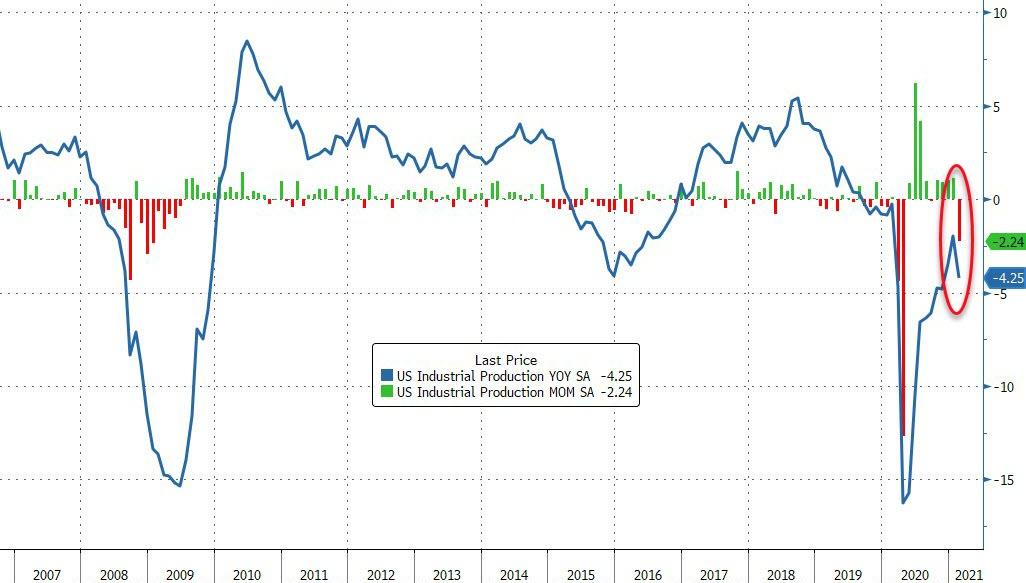
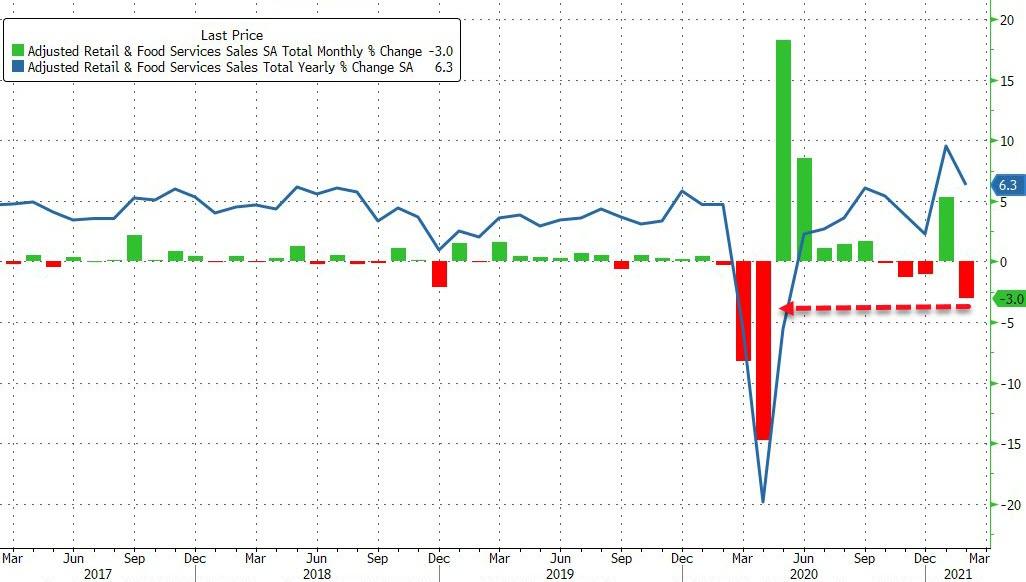
The latest economic news did nothing to spark the mood with US Industrial Production unexpectedly plunging in February and Retail Sales collapsing, after a huge surge in January.
Maybe it was simply nervousness about tomorrow’s upcoming event of the week, namely the Fed’s guidance on interest rates and inflation. Markets are on the edge and any “hawkish” tones could lead to a sell off, but any “dovish” undertones will support the bullish theme.
2. ETFs in the Spotlight
In case you missed the announcement and description of this section, you can read it here again.
It features some of the 10 broadly diversified domestic and sector ETFs from my HighVolume list as posted every Saturday. Furthermore, they are screened for the lowest MaxDD% number meaning they have been showing better resistance to temporary sell offs than all others over the past year.
The below table simply demonstrates the magnitude with which these ETFs are fluctuating above or below their respective individual trend lines (%+/-M/A). A break below, represented by a negative number, shows weakness, while a break above, represented by a positive percentage, shows strength.
For hundreds of ETF choices, be sure to reference Thursday’s StatSheet.
For this current domestic “Buy” cycle, here’s how some our candidates have fared:
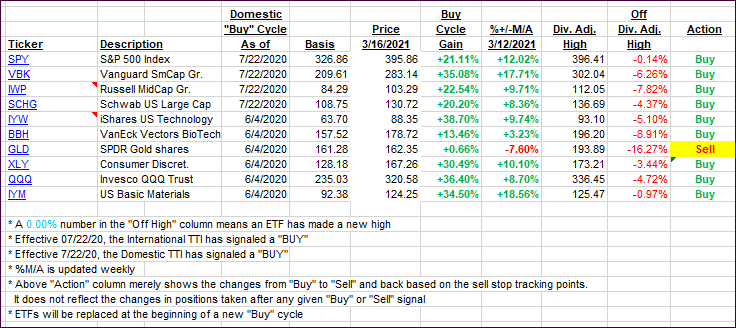
Click image to enlarge.
Again, the %+/-M/A column above shows the position of the various ETFs in relation to their respective long-term trend lines, while the trailing sell stops are being tracked in the “Off High” column. The “Action” column will signal a “Sell” once the -8% point has been taken out in the “Off High” column. For more volatile sector ETFs, the trigger point is -10%.
3. Trend Tracking Indexes (TTIs)
Our TTIs slipped a tad after an early rally bit the dust.
This is how we closed 3/16/2021:
Domestic TTI: +20.15% above its M/A (prior close +21.27%)—Buy signal effective 07/22/2020.
International TTI: +18.58% above its M/A (prior close +18.92%)—Buy signals effective 07/22/2020.
Disclosure: I am obliged to inform you that I, as well as my advisory clients, own some of the ETFs listed in the above table. Furthermore, they do not represent a specific investment recommendation for you, they merely show which ETFs from the universe I track are falling within the specified guidelines.
Contact Ulli