
- Moving the markets
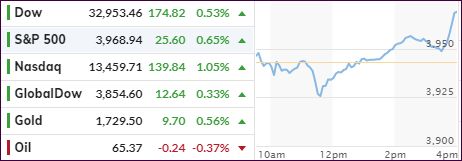
An early pop was shadowed by a mid-day drop, which was then followed by one more pop in the indexes with the Dow scoring another record high as economic reopening optimism prevailed.
The early plunge was the result of negative news from several European countries about blood blot concerns by vaccine developer AstraZeneca.
But equities recovered when the #1 party spoiler, namely rising bond yields, did not come into play today. The 10-year slipped almost 2 basis points but remains stubbornly above the 1.6% pain threshold, but traders were simply pleased by not seeing further spikes.
Still, the tug-of-war goes on between those who believe that equities should be able to absorb roughly 2% yields, while others call for a 20% collapse in the Nasdaq should this level be reached.
Therefore, Wednesday’s upcoming verdict by the Fed regarding interest rates will be dissected down to the last word. Will they fine-tune their interest rate outlook, which currently does not consider any rate hikes through 2023?
Any unexpected wording will affect markets instantly.
2. ETFs in the Spotlight
In case you missed the announcement and description of this section, you can read it here again.
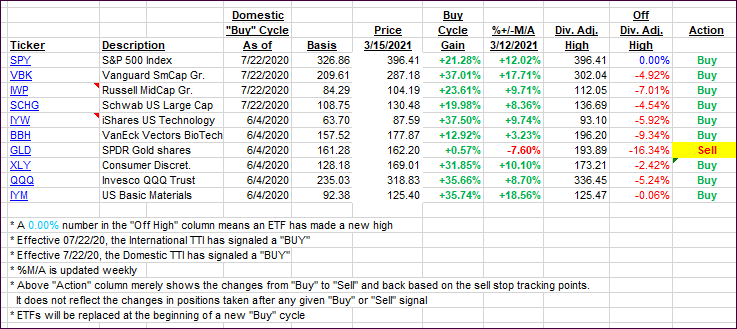
It features some of the 10 broadly diversified domestic and sector ETFs from my HighVolume list as posted every Saturday. Furthermore, they are screened for the lowest MaxDD% number meaning they have been showing better resistance to temporary sell offs than all others over the past year.
The below table simply demonstrates the magnitude with which these ETFs are fluctuating above or below their respective individual trend lines (%+/-M/A). A break below, represented by a negative number, shows weakness, while a break above, represented by a positive percentage, shows strength.
For hundreds of ETF choices, be sure to reference Thursday’s StatSheet.
For this current domestic “Buy” cycle, here’s how some our candidates have fared:
Click image to enlarge.
Again, the %+/-M/A column above shows the position of the various ETFs in relation to their respective long-term trend lines, while the trailing sell stops are being tracked in the “Off High” column. The “Action” column will signal a “Sell” once the -8% point has been taken out in the “Off High” column. For more volatile sector ETFs, the trigger point is -10%.
3. Trend Tracking Indexes (TTIs)
Our TTIs moved higher when a late rally wiped out early losses.
This is how we closed 3/15/2021:
Domestic TTI: +21.27% above its M/A (prior close +20.25%)—Buy signal effective 07/22/2020.
International TTI: +18.92% above its M/A (prior close +18.57%)—Buy signals effective 07/22/2020.
Disclosure: I am obliged to inform you that I, as well as my advisory clients, own some of the ETFs listed in the above table. Furthermore, they do not represent a specific investment recommendation for you, they merely show which ETFs from the universe I track are falling within the specified guidelines.
Contact Ulli