
- Moving the markets
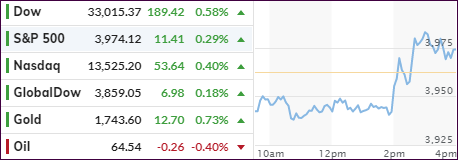
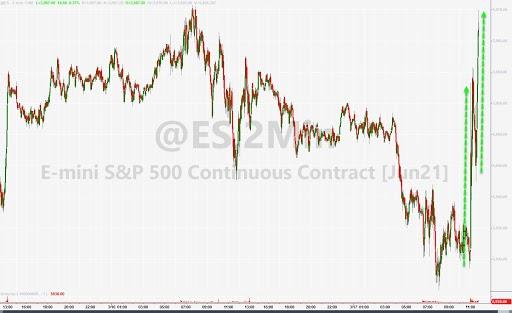
As I suggested yesterday, the Fed’s guidance on interest rates could push markets one way or another. That’s exactly what happened by stocks exploding higher, with the S&P 500 and Nasdaq having to crawl out of an early hole, after the Fed’s statement indicated more dovishness than expected.
Postulated ZH:
And since it is now painfully obvious that Powell will never again do anything to rock the boat, we are certain that an SLR extension (Supplementary Liquidity Ratio) is coming in the coming days, the news of which will unleash another buying spree…
The Fed delivered and the while the markets were pleased, the rally was only modest, considering the anxiety leading up to the event.
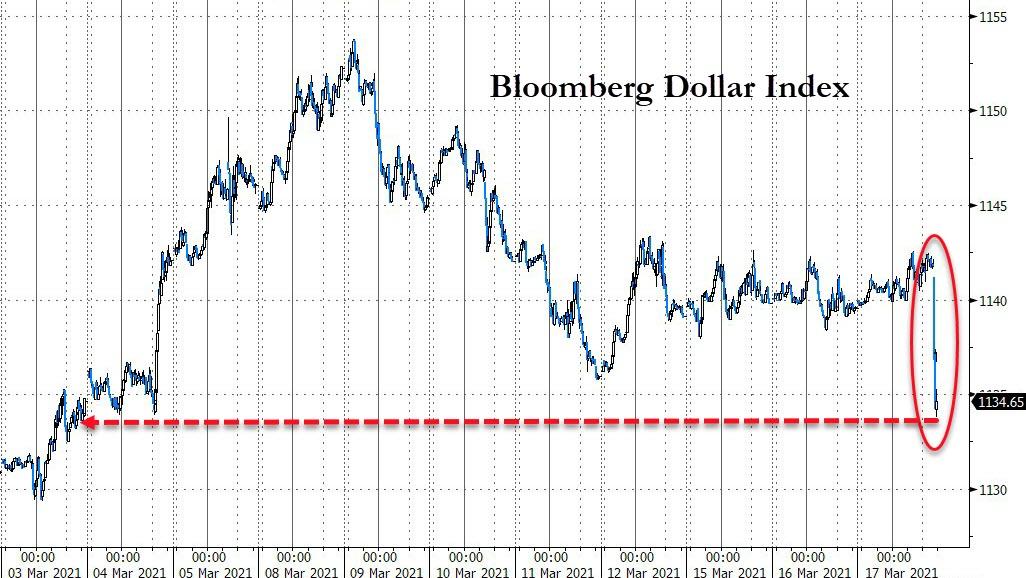
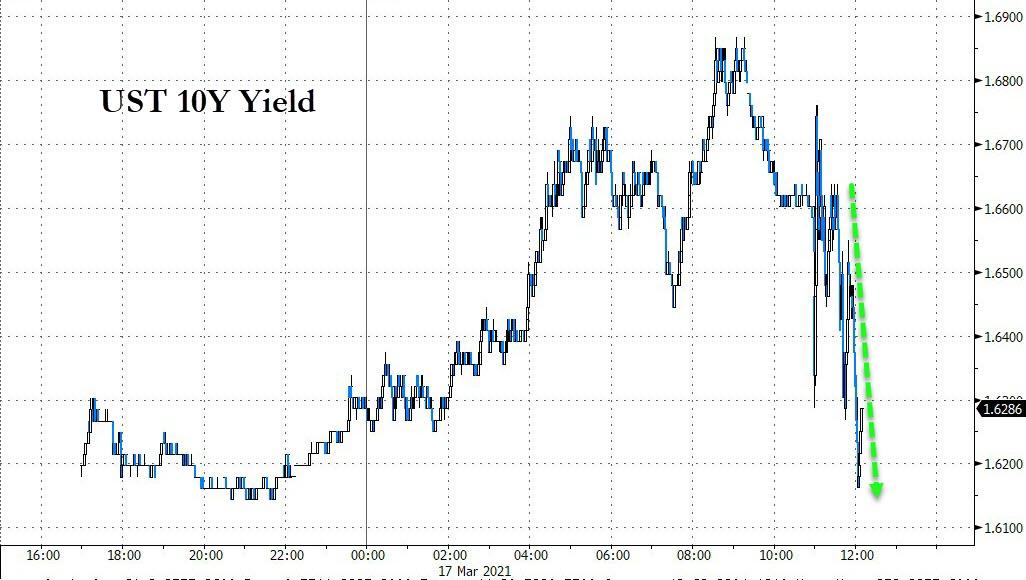
The US Dollar Index plunged, and the 10-year bond yield slumped, after an early pump and ended the session at 1.645%, down 2.7 basis points. Both events proved to be a boon for the Gold ETF GLD, which took top billing for a change with a gain of +0.71%.
We’re now within spitting distance of the S&P 500 reaching another milestone, namely its 4,000 mark. I expect that several attempts will be necessary before this glass ceiling can be broken.
2. ETFs in the Spotlight
In case you missed the announcement and description of this section, you can read it here again.
It features some of the 10 broadly diversified domestic and sector ETFs from my HighVolume list as posted every Saturday. Furthermore, they are screened for the lowest MaxDD% number meaning they have been showing better resistance to temporary sell offs than all others over the past year.
The below table simply demonstrates the magnitude with which these ETFs are fluctuating above or below their respective individual trend lines (%+/-M/A). A break below, represented by a negative number, shows weakness, while a break above, represented by a positive percentage, shows strength.
For hundreds of ETF choices, be sure to reference Thursday’s StatSheet.
For this current domestic “Buy” cycle, here’s how some our candidates have fared:
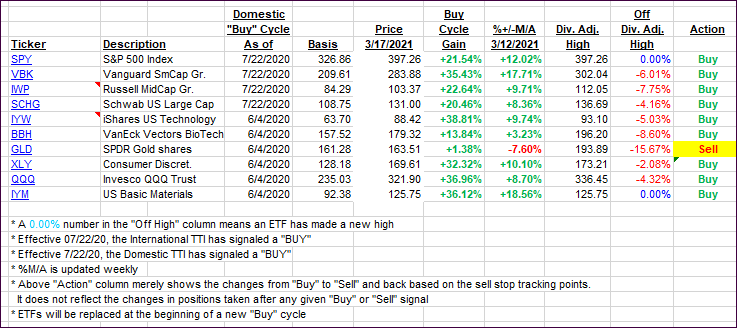
Click image to enlarge.
Again, the %+/-M/A column above shows the position of the various ETFs in relation to their respective long-term trend lines, while the trailing sell stops are being tracked in the “Off High” column. The “Action” column will signal a “Sell” once the -8% point has been taken out in the “Off High” column. For more volatile sector ETFs, the trigger point is -10%.
3. Trend Tracking Indexes (TTIs)
Our TTIs headed north thanks to the Fed’s dovish announcement.
This is how we closed 3/17/2021:
Domestic TTI: +20.77% above its M/A (prior close +20.15%)—Buy signal effective 07/22/2020.
International TTI: +19.06% above its M/A (prior close +18.58%)—Buy signals effective 07/22/2020.
Disclosure: I am obliged to inform you that I, as well as my advisory clients, own some of the ETFs listed in the above table. Furthermore, they do not represent a specific investment recommendation for you, they merely show which ETFs from the universe I track are falling within the specified guidelines.
Contact Ulli