
- Moving the markets
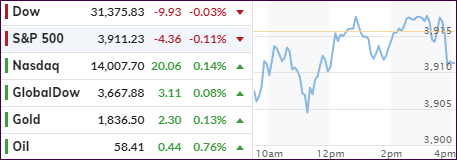
After the relentless march higher over the past 6 trading days, it was time for a pause. That is exactly what we saw today, as the major indexes dropped early on, recovered, and then hung around their respective unchanged lines. Only the Nasdaq was able to eke out a green close, albeit a tiny one, as the chart above shows.
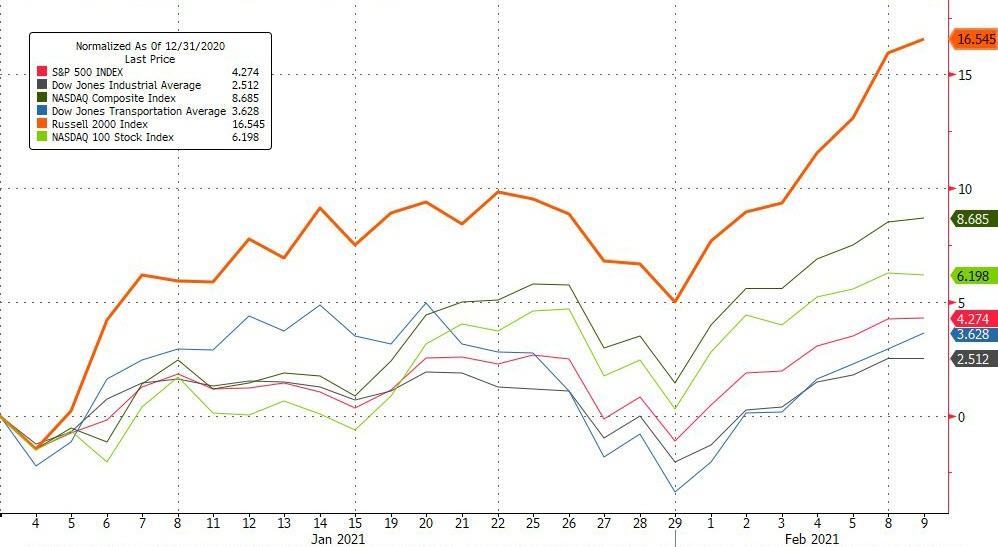
Yet, despite this trip to nowhere, some of our holdings bucked the trend thereby turning this day into a positive one. Given its YTD history, you will not be surprised to hear that SmallCaps (IWO) ruled with another solid showing of +0.72%, which was closely followed by MidCaps (IWP) with +0.54%.
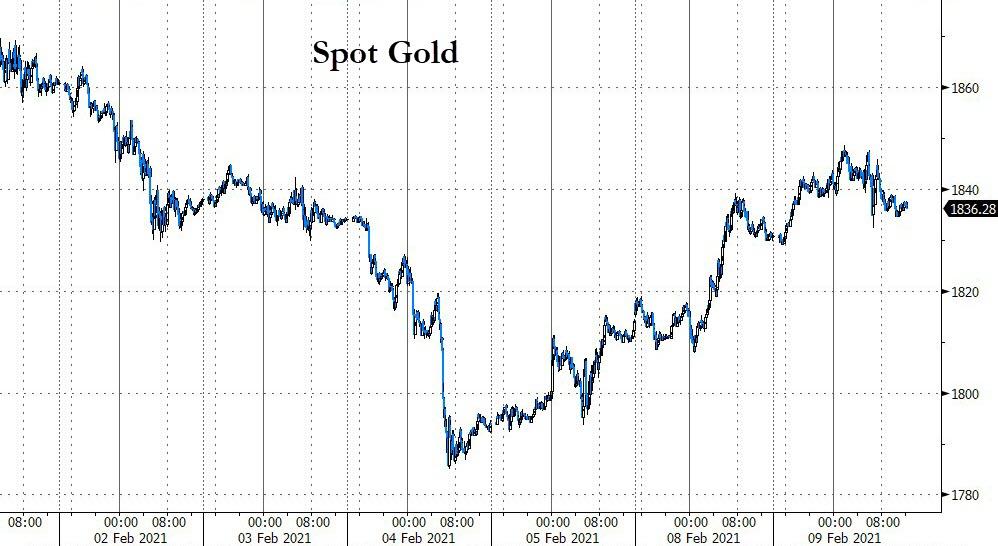
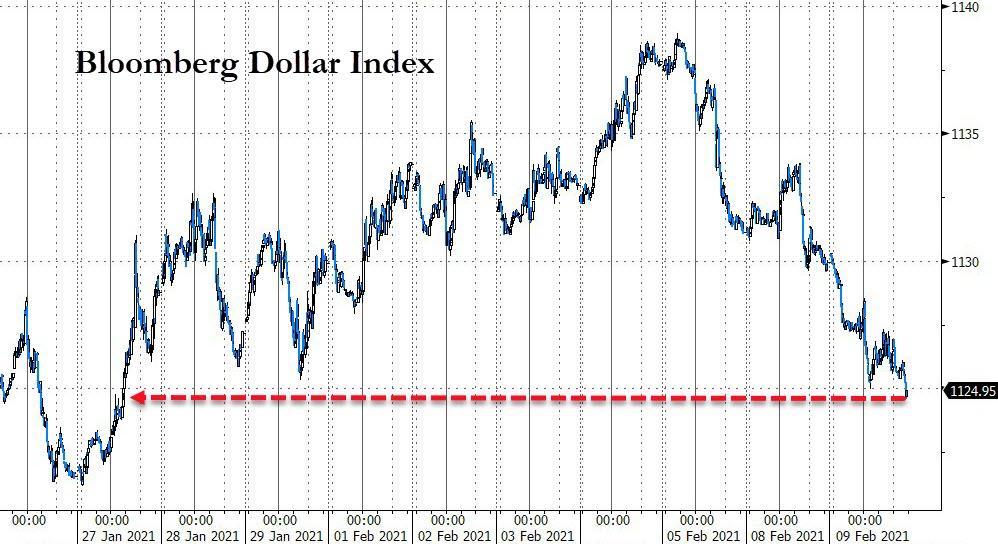
Even GLD managed a green close for the second day in a row by adding +0.34%, supported by a sliding US Dollar and lower bond yields.
With market optimism continuing unabated, BofA Research had this to say:
“Among the pillars of this unprecedented bullish sentiment is the market’s pricing in of perfection on the policy front (maximal Fed accommodation, smooth fiscal passage of $1.9tn and more, and a steady vaccine rollout) while improvement from economic data may already be “as good as it gets”.
Then this word of caution and a suggestion:
Bank of America said a market correction could be on the horizon as the recent runup has shown signs of overheating, but it will be a buying opportunity for equity investors.
If all else fails, that’s how you cover both sides of the equation.
2. ETFs in the Spotlight
In case you missed the announcement and description of this section, you can read it here again.
It features some of the 10 broadly diversified domestic and sector ETFs from my HighVolume list as posted every Saturday. Furthermore, they are screened for the lowest MaxDD% number meaning they have been showing better resistance to temporary sell offs than all others over the past year.
The below table simply demonstrates the magnitude with which these ETFs are fluctuating above or below their respective individual trend lines (%+/-M/A). A break below, represented by a negative number, shows weakness, while a break above, represented by a positive percentage, shows strength.
For hundreds of ETF choices, be sure to reference Thursday’s StatSheet.
For this current domestic “Buy” cycle, here’s how some our candidates have fared:
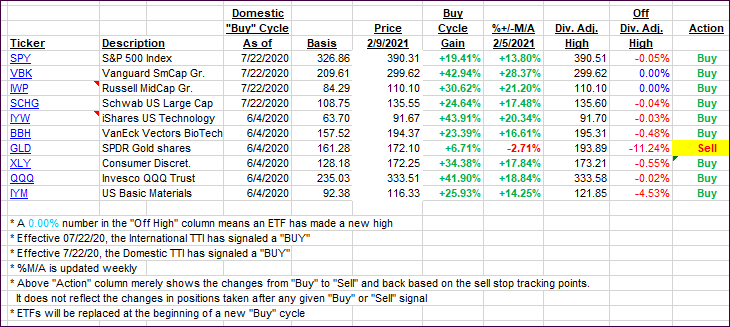
Click image to enlarge.
Again, the %+/-M/A column above shows the position of the various ETFs in relation to their respective long-term trend lines, while the trailing sell stops are being tracked in the “Off High” column. The “Action” column will signal a “Sell” once the -8% point has been taken out in the “Off High” column. For more volatile sector ETFs, the trigger point is -10%.
3. Trend Tracking Indexes (TTIs)
Our TTIs went nowhere with market direction being flat for the major indexes.
This is how we closed 2/09/2021:
Domestic TTI: +18.73% above its M/A (prior close +18.78%)—Buy signal effective 07/22/2020.
International TTI: +17.80% above its M/A (prior close +17.69%)—Buy signal effective 07/22/2020.
Disclosure: I am obliged to inform you that I, as well as my advisory clients, own some of the ETFs listed in the above table. Furthermore, they do not represent a specific investment recommendation for you, they merely show which ETFs from the universe I track are falling within the specified guidelines.
Contact Ulli