
- Moving the markets
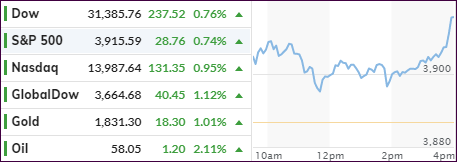
While spending the day in the green, the major indexes vacillated but managed to find more upward momentum during the last hour of the session and ramped into the close.
The gains were solid with the Nasdaq leading the pack with +0.95%, yet it was outperformed by SmallCaps (IWO), showing again who the top dog is with an astonishing +2.38%.
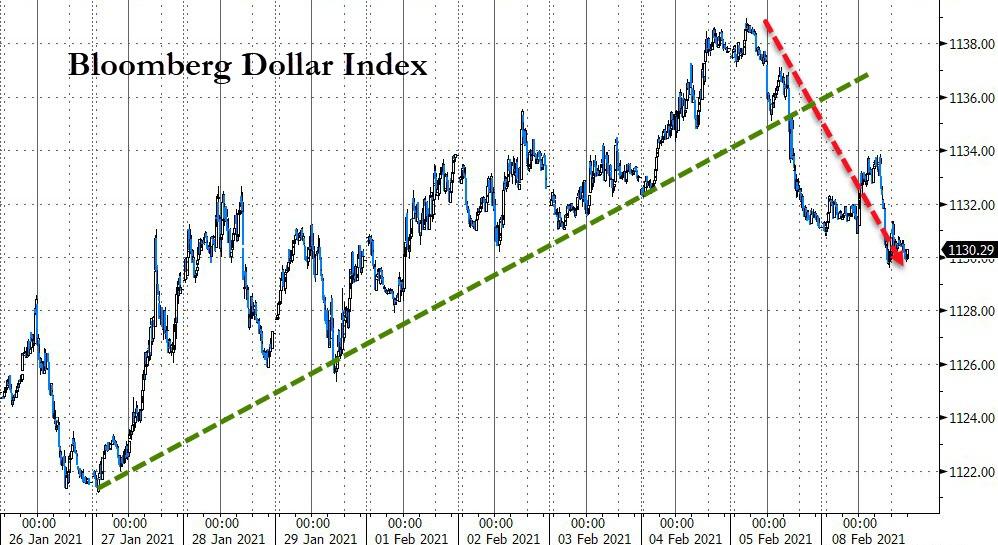
A rare but not unexpected advance came from the precious metals sector, as Gold finally managed to put up a good number by adding +1.11%, thanks to in part of the US Dollar’s dive.
Today’s bullish mood came on the heels of last week’s outstanding showing with traders remaining optimistic about additional Covid stimulus and an ongoing nascent economic recovery.
The Dow and the S&P 500 scored record highs with both indexes now having risen for six days straight, which represents their longest streak since August. However, SmallCaps deserve most of the attention, as its benchmark has now surged some +15% in 2021.
Adding to economic hopes, strategist Tony Dwyer of Canaccord Genuity noted:
“While the economy is likely in a short-term stall as vaccinations roll through the population, it would take an epic unforeseen failure in the rollout of the various vaccines to prevent the domestic and economic engine from ramping greater than most expect.”
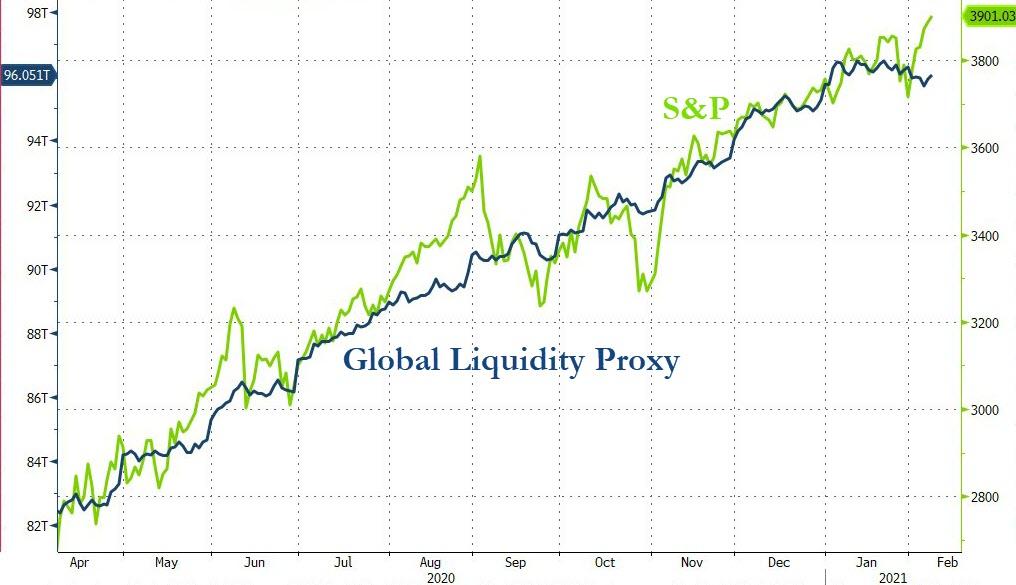
However, let’s not forget the main contributor to the relentless upswing in equities, namely the mind boggling trillions of dollars in liquidity sloshing into the markets, as ZH called it.
One analyst, Larry MacDonald, described that phenomenon like this:
“The combo of a near $1 trillion check and $120 billion monthly QE is the monetary equivalent of eating a banana split after downing an Italian hero sandwich. The market will be stuffed with reserves.”
2. ETFs in the Spotlight
In case you missed the announcement and description of this section, you can read it here again.
It features some of the 10 broadly diversified domestic and sector ETFs from my HighVolume list as posted every Saturday. Furthermore, they are screened for the lowest MaxDD% number meaning they have been showing better resistance to temporary sell offs than all others over the past year.
The below table simply demonstrates the magnitude with which these ETFs are fluctuating above or below their respective individual trend lines (%+/-M/A). A break below, represented by a negative number, shows weakness, while a break above, represented by a positive percentage, shows strength.
For hundreds of ETF choices, be sure to reference Thursday’s StatSheet.
For this current domestic “Buy” cycle, here’s how some our candidates have fared:
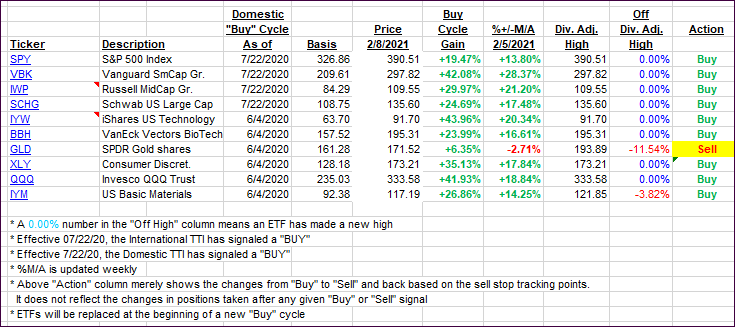
Click image to enlarge.
Again, the %+/-M/A column above shows the position of the various ETFs in relation to their respective long-term trend lines, while the trailing sell stops are being tracked in the “Off High” column. The “Action” column will signal a “Sell” once the -8% point has been taken out in the “Off High” column. For more volatile sector ETFs, the trigger point is -10%.
3. Trend Tracking Indexes (TTIs)
Our TTIs jumped as the major indexes rallied into the close.
This is how we closed 2/08/2021:
Domestic TTI: +18.78% above its M/A (prior close +17.40%)—Buy signal effective 07/22/2020.
International TTI: +17.69% above its M/A (prior close +16.47%)—Buy signal effective 07/22/2020.
Disclosure: I am obliged to inform you that I, as well as my advisory clients, own some of the ETFs listed in the above table. Furthermore, they do not represent a specific investment recommendation for you, they merely show which ETFs from the universe I track are falling within the specified guidelines.
Contact Ulli