
- Moving the markets
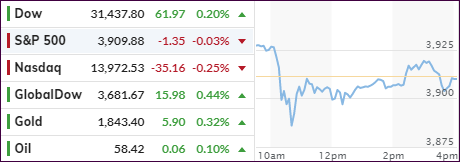
Up—down—sideways—up, and down pretty much describes the journey the major indexes took today with the result being an unchanged outcome. However, the Dow squeezed out a tiny gain of +0.20%, but that move was sufficient for the index to eke out another record closing high.
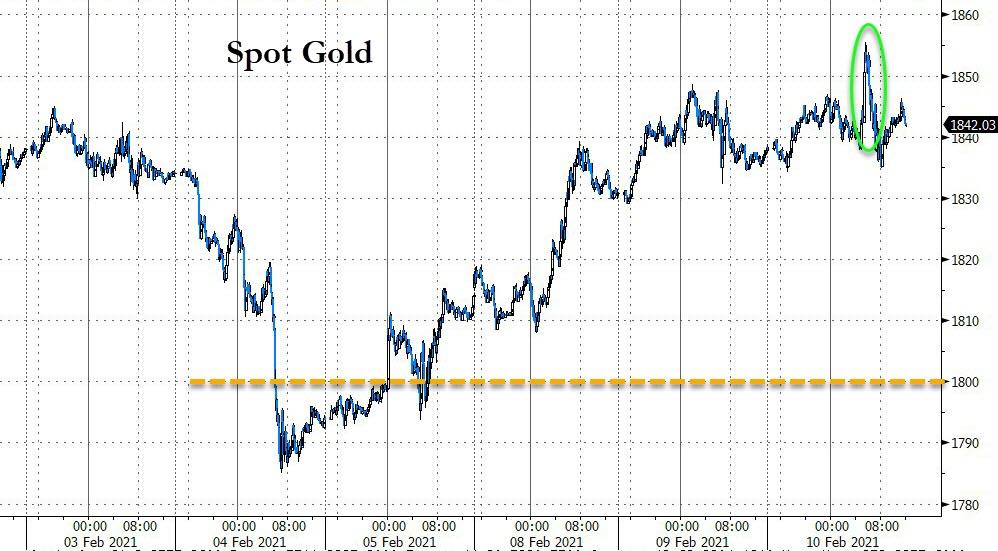
Not even SmallCaps, the winner YTD, were able to gather any momentum and ended lower by -1.07%. Saving the day to a small degree were MidCaps (IWO) with +0.16% and GLD, which again managed a green close by adding another +0.39%.
All eyes were on the outcome of a Fed speech with CNBC describing it like this:
Federal Reserve Chairman Jerome Powell said Wednesday monetary policy needs to stay “patiently accommodative” to support the economy that still faces challenges in the labor market. The employment picture is “a long way” from where it needs to be, the central bank chief told the Economic Club of New York.
Despite the past 2 days having been non-events in terms of performance, keep in mind that so far this has been a strong February with the S&P 500 having gained some 5%, mainly because of continued optimism about the massive Covid-19 stimulus package with more on deck, according to CNBC:
House Democrats unveiled the details of a relief proposal that included $1,400 direct checks with faster phase-outs than previous bills. President Joe Biden and Treasury Secretary Janet Yellen met with CEOs of JPMorgan, Walmart and Gap Tuesday to discuss additional economic relief.
All the above, if executed as planned, will be exactly the kind of accommodation the markets are looking for and should keep equities moving higher—until the day they won’t. But that moment in time is an unknown date in the future. It also is the main reason why I continue to pounce on the importance of having an exit strategy.
2. ETFs in the Spotlight
In case you missed the announcement and description of this section, you can read it here again.
It features some of the 10 broadly diversified domestic and sector ETFs from my HighVolume list as posted every Saturday. Furthermore, they are screened for the lowest MaxDD% number meaning they have been showing better resistance to temporary sell offs than all others over the past year.
The below table simply demonstrates the magnitude with which these ETFs are fluctuating above or below their respective individual trend lines (%+/-M/A). A break below, represented by a negative number, shows weakness, while a break above, represented by a positive percentage, shows strength.
For hundreds of ETF choices, be sure to reference Thursday’s StatSheet.
For this current domestic “Buy” cycle, here’s how some our candidates have fared:
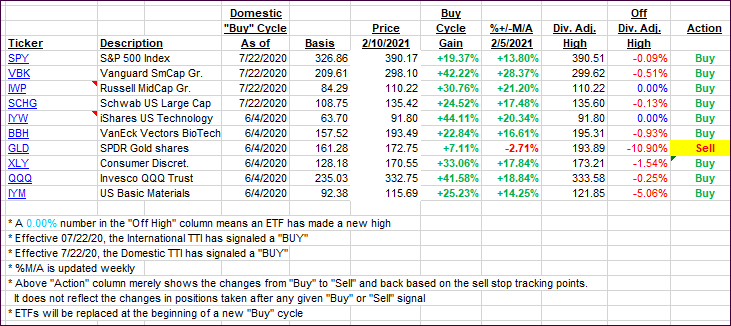
Click image to enlarge.
Again, the %+/-M/A column above shows the position of the various ETFs in relation to their respective long-term trend lines, while the trailing sell stops are being tracked in the “Off High” column. The “Action” column will signal a “Sell” once the -8% point has been taken out in the “Off High” column. For more volatile sector ETFs, the trigger point is -10%.
3. Trend Tracking Indexes (TTIs)
Our TTIs inched up a tad, despite the broad market being flat.
This is how we closed 2/10/2021:
Domestic TTI: +19.10% above its M/A (prior close +18.73%)—Buy signal effective 07/22/2020.
International TTI: +18.24% above its M/A (prior close +17.80%)—Buy signal effective 07/22/2020.
Disclosure: I am obliged to inform you that I, as well as my advisory clients, own some of the ETFs listed in the above table. Furthermore, they do not represent a specific investment recommendation for you, they merely show which ETFs from the universe I track are falling within the specified guidelines.
Contact Ulli