
- Moving the markets
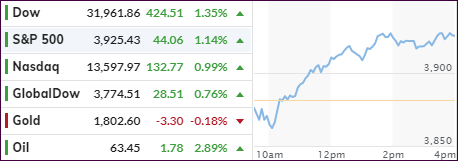
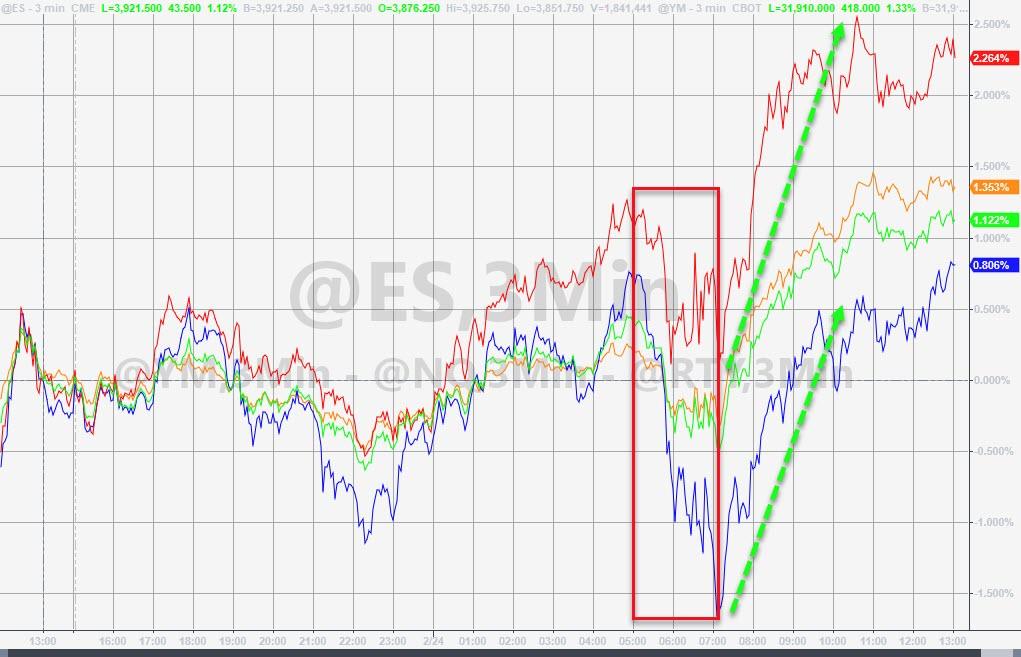
An early market dump received an unexpected assist, which turned into a big intraday comeback. Unlike yesterday, when Fed head Powell uttered some soothing remarks to pull equities out of a deep hole, today, the torch was passed.
It was none other than Fed Gov Lael Brainard who took center stage first and voiced this dovish comment:
“The economy remains far from our goals in terms of both employment and inflation, and it will take some time to achieve substantial further progress.”
This was followed by Powell’s semi-annual testimony, which was market friendly and contained no surprises, after which stocks and bonds went on a rampage.
Yes, that was all it took for the markets to change direction and shift into high gear with all 3 major indexes soaring, led by the Dow. Even the Nasdaq and SmallCaps (IWO), which have struggled as of late, catapulted higher by +0.99% and +2.10%.
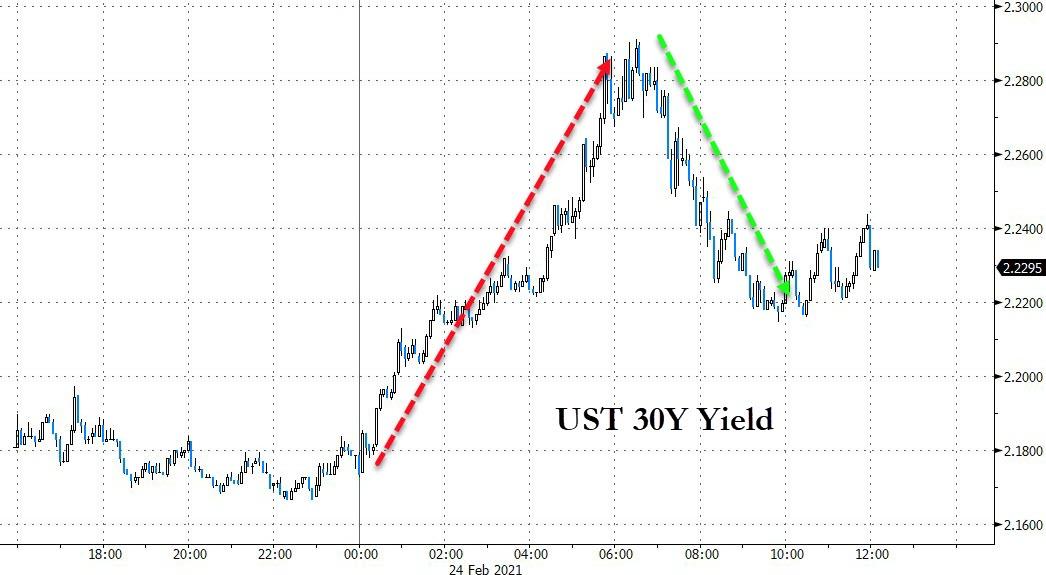
Rising bond yields also shifted in reverse with the 30-year dropping 5 basis points from intraday highs while the 10-year performed similar magic. For sure, had it not been for the “rescue operations” by the above Fed Gov/Powell team, we might have seen an ugly sell off.
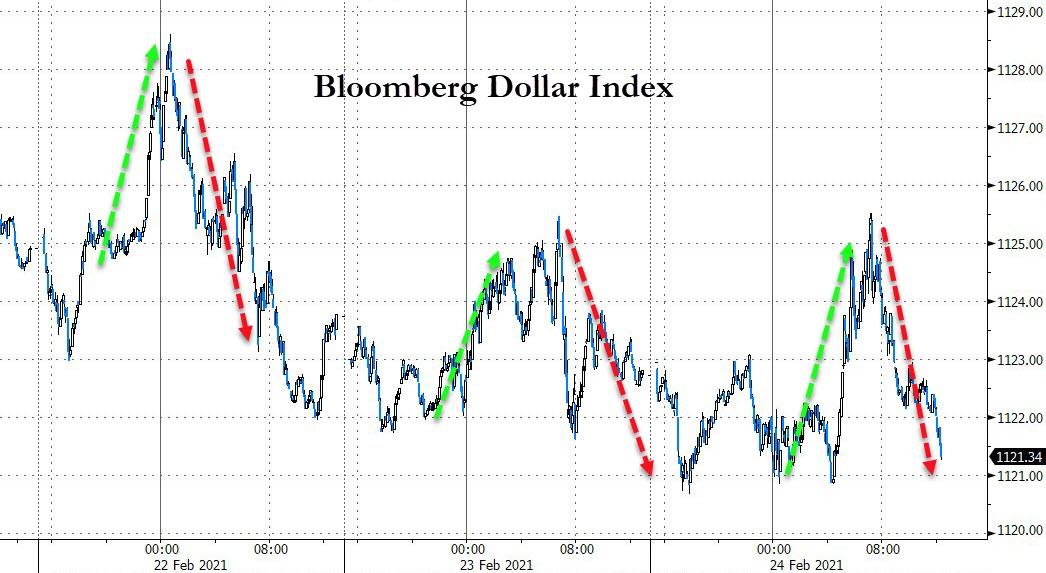
The US Dollar could not make up its mind and simply roundtripped, thereby pushing Gold around, however, the precious metal did not gain anything yet managed to hang on to its $1,800 level.
This day leaves me pondering “who will save the markets tomorrow?”
2. ETFs in the Spotlight
In case you missed the announcement and description of this section, you can read it here again.
It features some of the 10 broadly diversified domestic and sector ETFs from my HighVolume list as posted every Saturday. Furthermore, they are screened for the lowest MaxDD% number meaning they have been showing better resistance to temporary sell offs than all others over the past year.
The below table simply demonstrates the magnitude with which these ETFs are fluctuating above or below their respective individual trend lines (%+/-M/A). A break below, represented by a negative number, shows weakness, while a break above, represented by a positive percentage, shows strength.
For hundreds of ETF choices, be sure to reference Thursday’s StatSheet.
For this current domestic “Buy” cycle, here’s how some our candidates have fared:
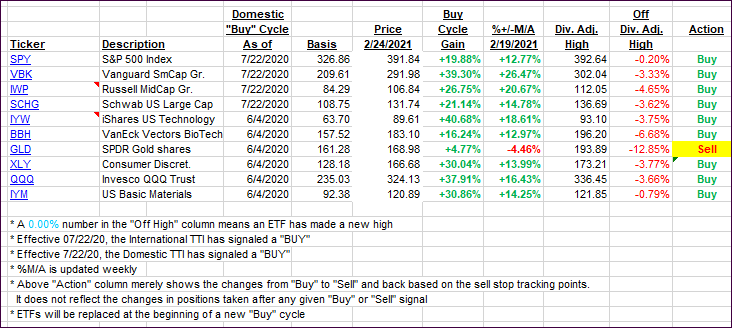
Click image to enlarge.
Again, the %+/-M/A column above shows the position of the various ETFs in relation to their respective long-term trend lines, while the trailing sell stops are being tracked in the “Off High” column. The “Action” column will signal a “Sell” once the -8% point has been taken out in the “Off High” column. For more volatile sector ETFs, the trigger point is -10%.
3. Trend Tracking Indexes (TTIs)
Our TTIs advance as today’s rebound was broad based.
This is how we closed 2/24/2021:
Domestic TTI: +20.19% above its M/A (prior close +18.32%)—Buy signal effective 07/22/2020.
International TTI: +19.03% above its M/A (prior close +18.08%)—Buy signal effective 07/22/2020.
Disclosure: I am obliged to inform you that I, as well as my advisory clients, own some of the ETFs listed in the above table. Furthermore, they do not represent a specific investment recommendation for you, they merely show which ETFs from the universe I track are falling within the specified guidelines.
Contact Ulli