
- Moving the markets
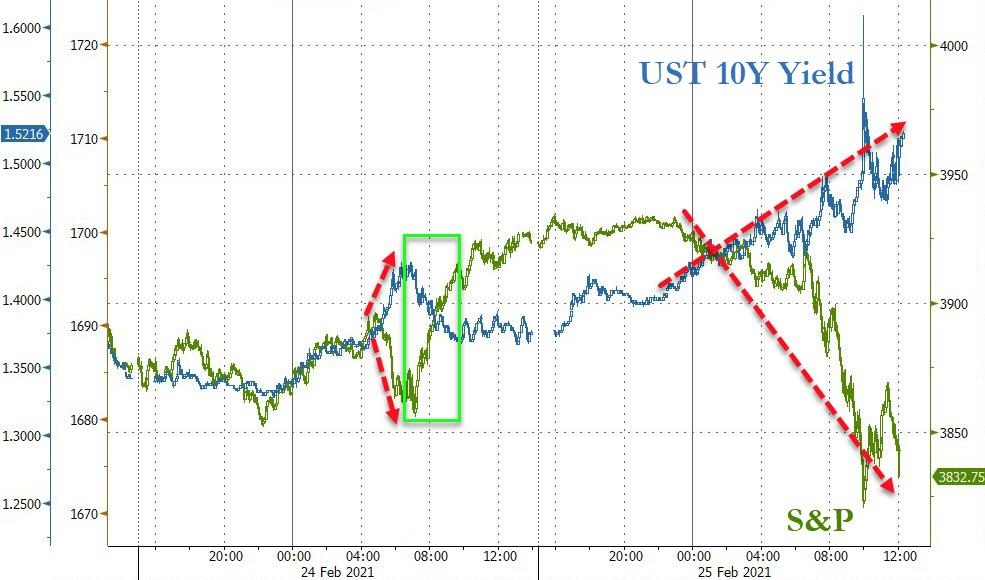
I have repeatedly pointed to rising bond yields as being the big equalizer that could affect equities negatively, and that’s what happened today. For the past 2 trading days, it was the Fed & Co. issuing well placed statements thereby assisting the major indexes to overcome early bearishness.
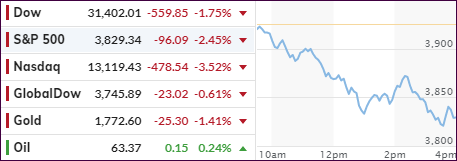
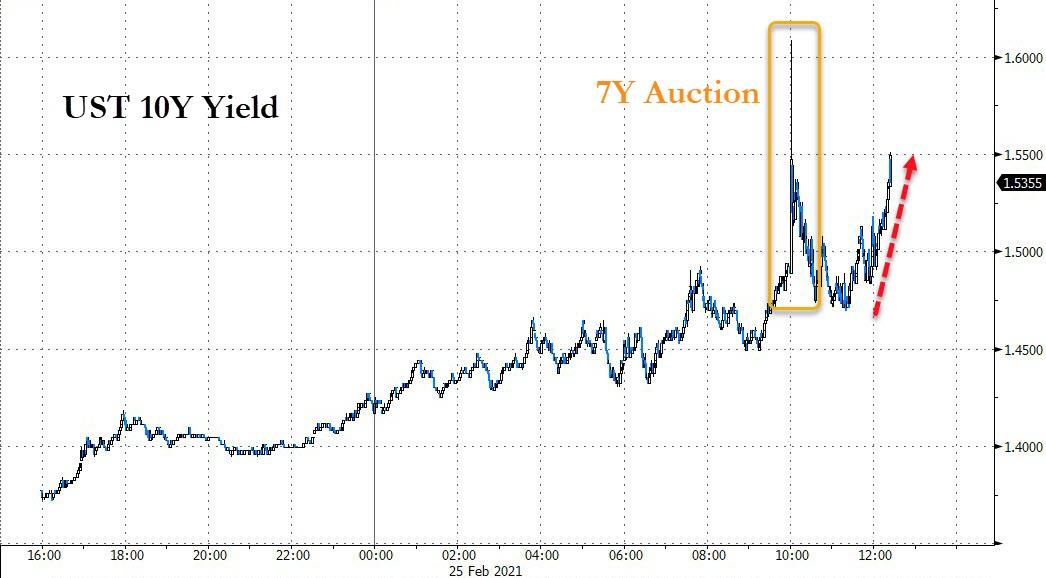
Where was the Fed head today? Nowhere to be heard is the answer, as bond yields continued their climb, thereby clobbering equities in the process. The 10-year soared above 1.6% in a sudden move, which some described as a “flash” spike. It settled at 1.523, up an astonishing 14 basis points.
Although some Fed mouthpieces tried to calm the nerves of traders, as ZH posted:
*FED’S BOSTIC SAYS “I AM NOT WORRIED” ABOUT MOVE IN YIELDS
*BOSTIC: FED DOESN’T NEED TO RESPOND TO YIELDS AT THIS POINT
*BOSTIC SAYS YIELDS STILL `VERY LOW’ FROM HISTORIC PERSPECTIVE
Even a mid-day rebound attempt in the major indexes had no chance of survival, and south we went. The Nasdaq got spanked the most and dropped -3.52% but was “outperformed” to the downside by the top gainer of the year, namely SmallCaps (IWO), which skidded -4.17%.
In the end, especially the bond/equity portfolios had their worst day since March 2020 due to bond yields rising and equities falling, causing bonds, which usually move opposite of equities, create even more pain for these types of portfolios. Case in point is the widely held 20-year bond ETF TLT, which got clobbered by -1.63%.
In other words, there was no offset to mitigate the fall of equities.
Not helping matters were hedge fund liquidations to cover margin calls in stocks they had re-shorted, and which were squeezed higher, thereby forcing fund managers to liquidate quality assets (tech sector) indiscriminately. Ouch!
Higher yields plus a rallying US Dollar kept Gold in check with the precious metal losing its $1,800 level again.
We are getting close to some of our trailing sell stops hitting their trigger points, and once that happens, they will be liquidated in accordance with our trading rules.
2. ETFs in the Spotlight
In case you missed the announcement and description of this section, you can read it here again.
It features some of the 10 broadly diversified domestic and sector ETFs from my HighVolume list as posted every Saturday. Furthermore, they are screened for the lowest MaxDD% number meaning they have been showing better resistance to temporary sell offs than all others over the past year.
The below table simply demonstrates the magnitude with which these ETFs are fluctuating above or below their respective individual trend lines (%+/-M/A). A break below, represented by a negative number, shows weakness, while a break above, represented by a positive percentage, shows strength.
For hundreds of ETF choices, be sure to reference Thursday’s StatSheet.
For this current domestic “Buy” cycle, here’s how some our candidates have fared:
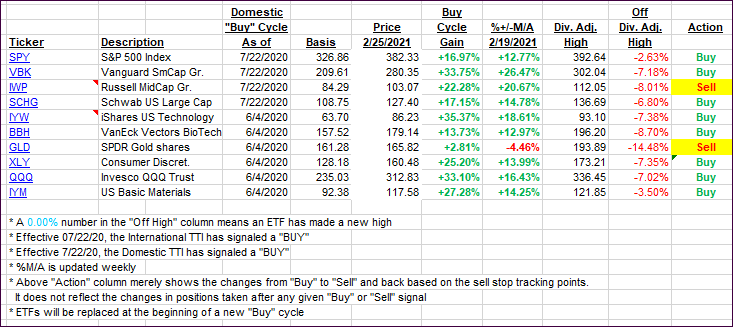
Click image to enlarge.
Again, the %+/-M/A column above shows the position of the various ETFs in relation to their respective long-term trend lines, while the trailing sell stops are being tracked in the “Off High” column. The “Action” column will signal a “Sell” once the -8% point has been taken out in the “Off High” column. For more volatile sector ETFs, the trigger point is -10%.
3. Trend Tracking Indexes (TTIs)
Our TTIs pulled back as bonds and stocks sank in unison.
This is how we closed 2/25/2021:
Domestic TTI: +17.39% above its M/A (prior close +20.19%)—Buy signal effective 07/22/2020.
International TTI: +18.14% above its M/A (prior close +19.03%)—Buy signal effective 07/22/2020.
Disclosure: I am obliged to inform you that I, as well as my advisory clients, own some of the ETFs listed in the above table. Furthermore, they do not represent a specific investment recommendation for you, they merely show which ETFs from the universe I track are falling within the specified guidelines.
Contact Ulli