
- Moving the markets
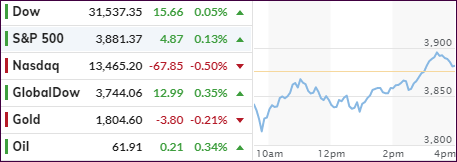
For the past few trading sessions, it seems like I am saying the same thing every day: A positive tone in overnight trading followed by a slam down at the opening. Today was no exception, but the major indexes managed a nice comeback with only the Nasdaq remaining down by -0.50% at the close, which was a great revival considering the lows of -2.5%.
While the Dow and S&P 500 crawled back into the green, it was only by a tiny margin, but we saw green, nonetheless. The Dow recovered from an early 360-point loss, which is quite remarkable.
SmallCaps (Russell 2000) dropped another 0.9% today, but they remain the top performer for this year with +7.6%.
Supporting the comeback were soothing words by Fed head Powell, as CNBC reported:
The intraday turnaround came after Powell said in his testimony to Congress that inflation is still “soft”, and the economic outlook is still “highly uncertain,” easing fears of a policy change by the central bank.
“The economy is a long way from our employment and inflation goals, and it is likely to take some time for substantial further progress to be achieved.”
With inflation fears having risen recently, causing surging bond yields, worries that more economic relief could force the Central Bank to raise borrowing costs, were somewhat alleviated after Powell’s speech.
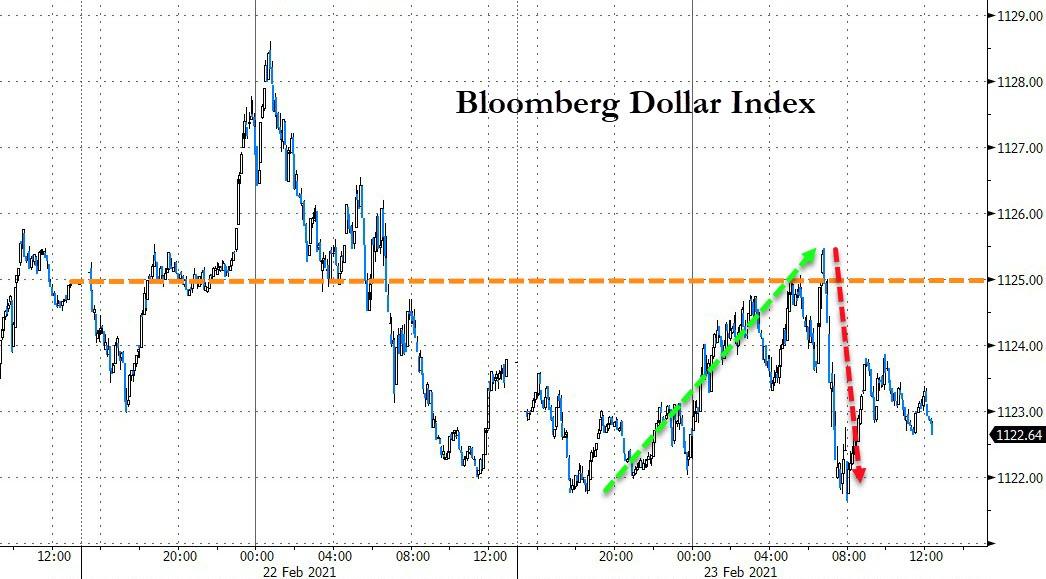
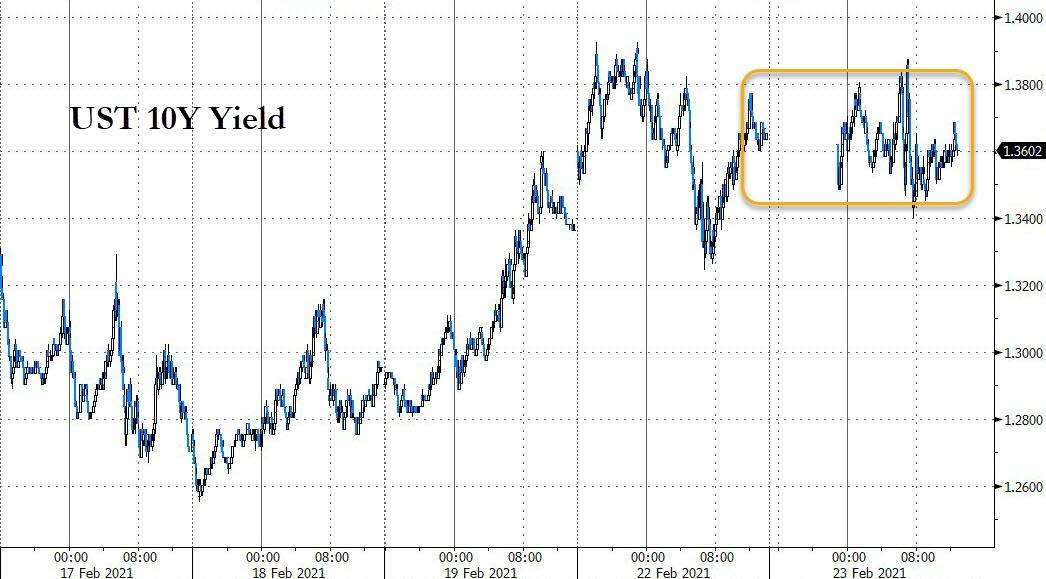
The US Dollar tumbled, Gold barely held on to the $1,800 level and 10-year bond yields went sideways.
All in all, today was a recovery day. We’ll have to wait and see if that upward momentum can carry over into the end of the month.
2. ETFs in the Spotlight
In case you missed the announcement and description of this section, you can read it here again.
It features some of the 10 broadly diversified domestic and sector ETFs from my HighVolume list as posted every Saturday. Furthermore, they are screened for the lowest MaxDD% number meaning they have been showing better resistance to temporary sell offs than all others over the past year.
The below table simply demonstrates the magnitude with which these ETFs are fluctuating above or below their respective individual trend lines (%+/-M/A). A break below, represented by a negative number, shows weakness, while a break above, represented by a positive percentage, shows strength.
For hundreds of ETF choices, be sure to reference Thursday’s StatSheet.
For this current domestic “Buy” cycle, here’s how some our candidates have fared:
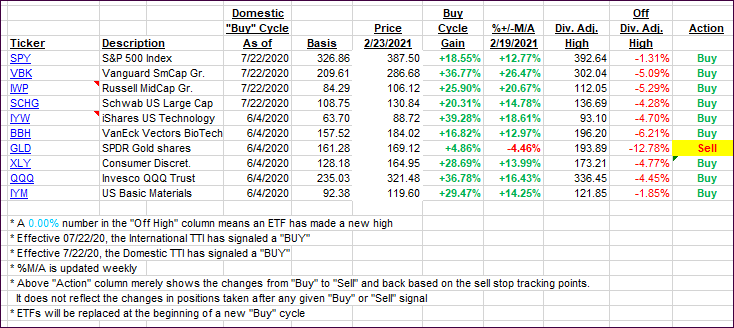
Click image to enlarge.
Again, the %+/-M/A column above shows the position of the various ETFs in relation to their respective long-term trend lines, while the trailing sell stops are being tracked in the “Off High” column. The “Action” column will signal a “Sell” once the -8% point has been taken out in the “Off High” column. For more volatile sector ETFs, the trigger point is -10%.
3. Trend Tracking Indexes (TTIs)
Our TTIs added a fraction due to most of today’s weakness being caused in the tech sector.
This is how we closed 2/23/2021:
Domestic TTI: +18.32% above its M/A (prior close +18.01%)—Buy signal effective 07/22/2020.
International TTI: +18.08% above its M/A (prior close +17.71%)—Buy signal effective 07/22/2020.
Disclosure: I am obliged to inform you that I, as well as my advisory clients, own some of the ETFs listed in the above table. Furthermore, they do not represent a specific investment recommendation for you, they merely show which ETFs from the universe I track are falling within the specified guidelines.
Contact Ulli