- Moving the markets
After touching new all-time highs (Dow and S&P) shortly after the opening, the bullish euphoria vanished in a hurry and made room for the bears to do some chest pounding for a change with the Dow down over 700 points at its worst level.
However, given the strong advances last month, this sell-off ended up being relatively modest, especially if you held Gold in your portfolio. The precious metal finally found some legs and surged an impressive +2.78% to recoup its $1,900 level—and that in the face of the US Dollar rebounding.
Leave it up to billionaire investor Carl Icahn, who uttered the words that not many on Wall Street wanted to hear:
“In my day, I’ve seen a lot of wild rallies with a lot of mispriced stocks, but there is one thing they all have in common. Eventually they hit a wall and go into a major painful correction.”
He is correct, but as always, the timing of such an event remains the big unknown. Leaving the traders with a sense of unease are tomorrow’s Senate runoff elections in Georgia, which could give the Democrats the majority in the chamber (Blue Wave).
Opined John Stoltzfus from Oppenheimer:
“It is thought by not just a few folks on Main Street as well as on Wall Street that if tomorrow’s run-off results in a sweep for the Democrats — providing them with control of the Senate as well as the House — that it would bode ill for business with the likelihood that corporate tax rates could rise substantially.”
And if that’s not enough excitement for you, it will be followed by more drama on Wednesday when the electoral votes are being counted in Washington. With so much uncertainty on deck, it’s no surprise that equities suffered their worst start to a year since the Dot-Com crash.
All bets on market direction are off this week, as short-term volatility based on the latest headlines will rule the markets, and we will have to wait and see if the bullish phase continues or if the bears take over.
2. ETFs in the Spotlight
In case you missed the announcement and description of this section, you can read it here again.
It features some of the 10 broadly diversified domestic and sector ETFs from my HighVolume list as posted every Saturday. Furthermore, they are screened for the lowest MaxDD% number meaning they have been showing better resistance to temporary sell offs than all others over the past year.
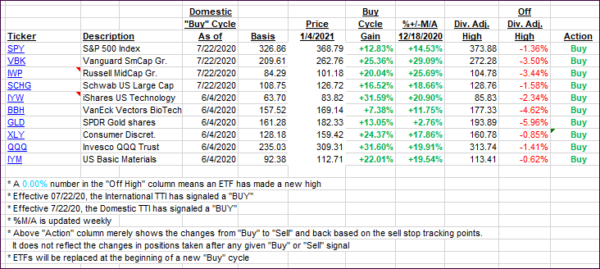
The below table simply demonstrates the magnitude with which these ETFs are fluctuating above or below their respective individual trend lines (%+/-M/A). A break below, represented by a negative number, shows weakness, while a break above, represented by a positive percentage, shows strength.
For hundreds of ETF choices, be sure to reference Thursday’s StatSheet.
For this current domestic “Buy” cycle, here’s how some our candidates have fared:

Click image to enlarge
Again, the %+/-M/A column above shows the position of the various ETFs in relation to their respective long-term trend lines, while the trailing sell stops are being tracked in the “Off High” column. The “Action” column will signal a “Sell” once the -8% point has been taken out in the “Off High” column. For more volatile sector ETFs, the trigger point is -10%.
3. Trend Tracking Indexes (TTIs)
Our TTIs dropped as the major indexes started the year to the downside.
This is how we closed 1/04/2021:
Domestic TTI: +16.46% above its M/A (prior close +18.17%)—Buy signal effective 07/22/2020
International TTI: +16.22% above its M/A (prior close +16.71%)—Buy signal effective 07/22/2020
Disclosure: I am obliged to inform you that I, as well as my advisory clients, own some of the ETFs listed in the above table. Furthermore, they do not represent a specific investment recommendation for you, they merely show which ETFs from the universe I track are falling within the specified guidelines.
Contact Ulli