
- Moving the markets
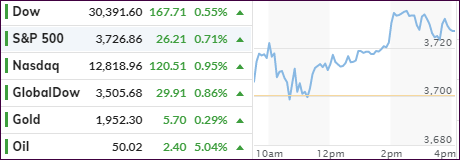
Even though the futures markets were mired in uncertainty and failed to rebound from Monday’s collapse, it was a different story once the cash markets opened.
The major indexes found some footing, dipped mid-day, but then staged a rebound that ended up in a green close.
As posted yesterday, the looming Georgia runoffs were on everyone’s mind, but for the time being, traders and algos alike decided to gamble on a strong economic recovery and in the process recovered some of yesterday’s losses.
Added CNBC:
Investors also looked ahead to two key elections in Georgia, which will determine whether Republicans can hold on to control in the Senate. Many fear that increased tax rates and more progressive policies could weigh on the market if Democrats gain control of the Senate.
However, such an outcome could create an opportunity for a bigger and faster spending package.
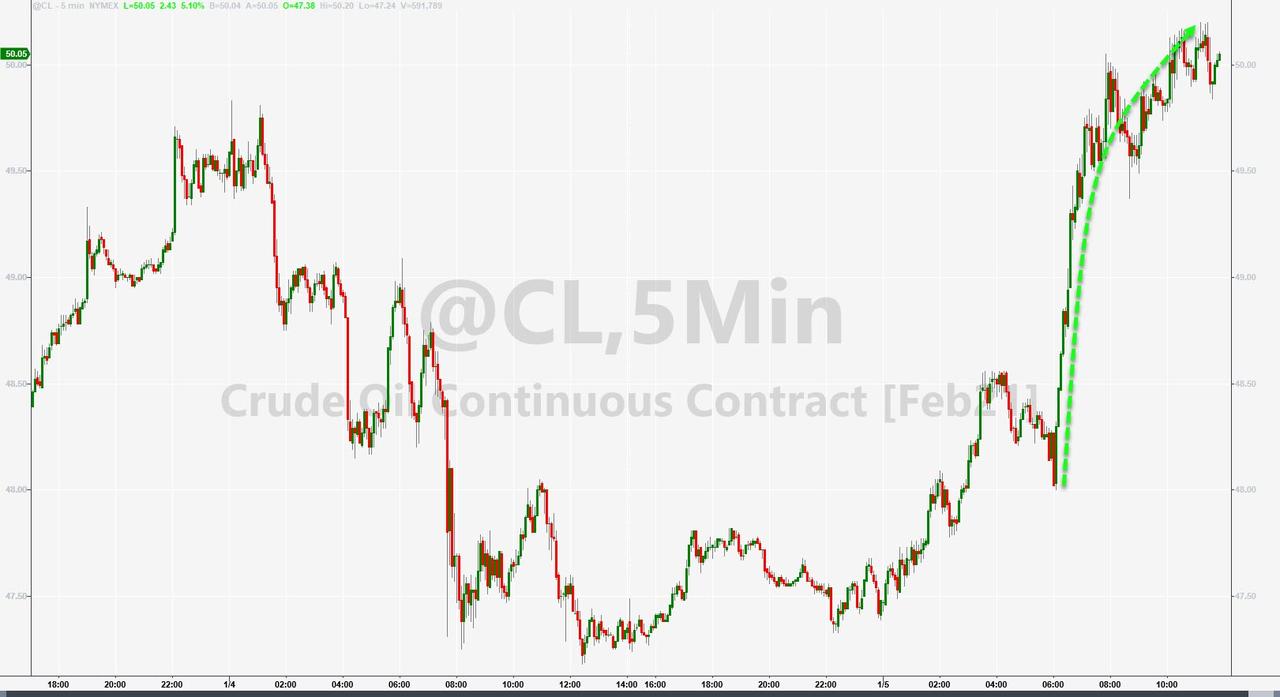
Even though the Nasdaq reigned supreme with a gain of +0.95%, SmallCaps continued with their unrelenting performance by adding +1.25%. On the other hand, Crude Oil stole the spotlight with a jaw dropping advance of +5.04%, its first move above $50 since February.
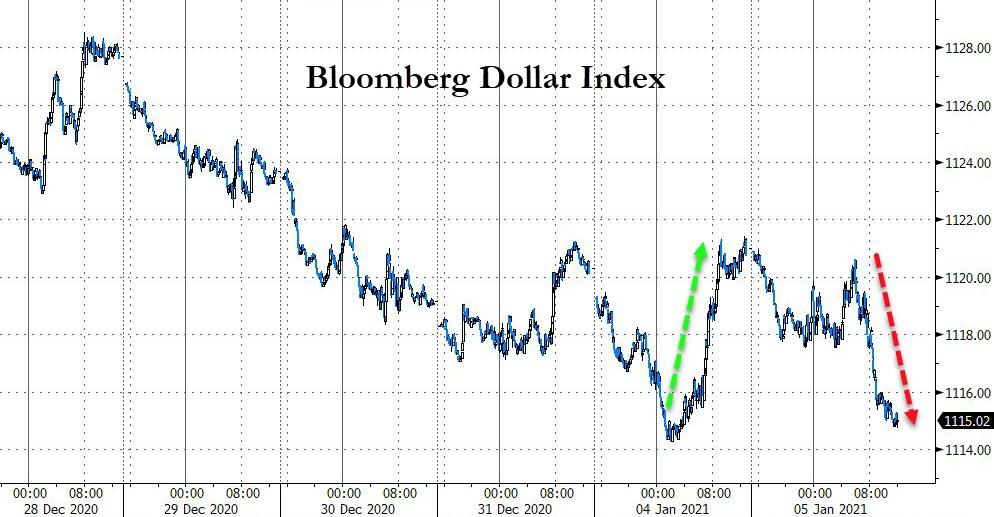
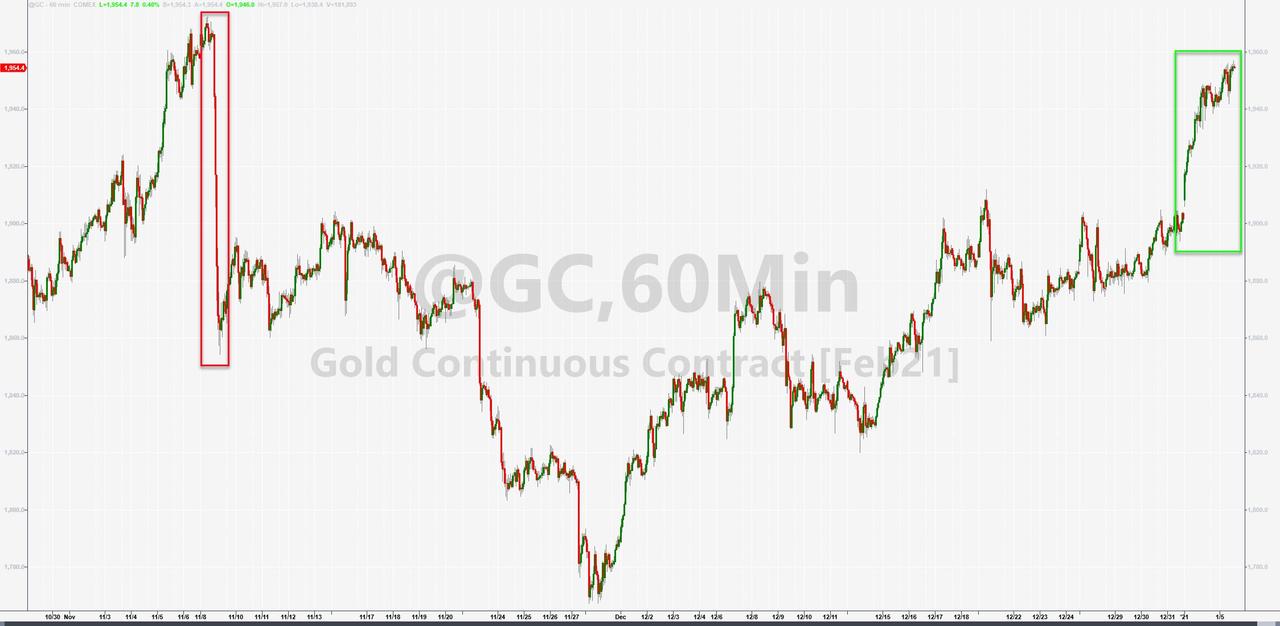
Bond yields rose but remain stuck in a tight trading range, although the US Dollar pumped and dumped, thereby helping Gold to score its second win in a row and also climbing above the $1,950 level.
For sure, we will some effect on the markets tomorrow whether the Georgia vote counting ends tonight or not.
2. ETFs in the Spotlight
In case you missed the announcement and description of this section, you can read it here again.
It features some of the 10 broadly diversified domestic and sector ETFs from my HighVolume list as posted every Saturday. Furthermore, they are screened for the lowest MaxDD% number meaning they have been showing better resistance to temporary sell offs than all others over the past year.
The below table simply demonstrates the magnitude with which these ETFs are fluctuating above or below their respective individual trend lines (%+/-M/A). A break below, represented by a negative number, shows weakness, while a break above, represented by a positive percentage, shows strength.
For hundreds of ETF choices, be sure to reference Thursday’s StatSheet.
For this current domestic “Buy” cycle, here’s how some our candidates have fared:
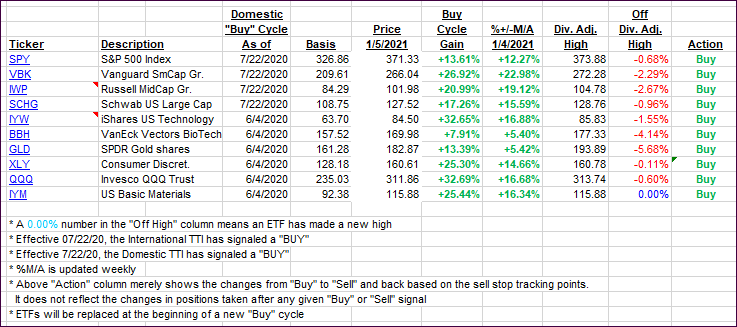
Click image to enlarge
Again, the %+/-M/A column above shows the position of the various ETFs in relation to their respective long-term trend lines, while the trailing sell stops are being tracked in the “Off High” column. The “Action” column will signal a “Sell” once the -8% point has been taken out in the “Off High” column. For more volatile sector ETFs, the trigger point is -10%.
3. Trend Tracking Indexes (TTIs)
Our TTIs recovered and ended solidly higher.
This is how we closed 1/05/2021:
Domestic TTI: +17.46% above its M/A (prior close +16.46%)—Buy signal effective 07/22/2020
International TTI: +17.32% above its M/A (prior close +16.22%)—Buy signal effective 07/22/2020
Disclosure: I am obliged to inform you that I, as well as my advisory clients, own some of the ETFs listed in the above table. Furthermore, they do not represent a specific investment recommendation for you, they merely show which ETFs from the universe I track are falling within the specified guidelines.
Contact Ulli