
- Moving the markets
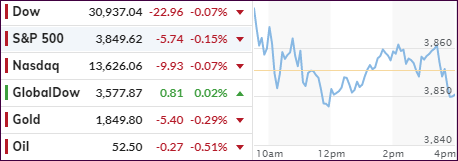
The direction the futures markets take is not always an indication as to what will happen during the regular trading session. Such was the case last night, with the major indexes were down some -0.5%, but they opened in the green yet ended up meandering aimlessly all day.
Even Nasdaq trading was subdued with Big Tech earnings on deck, as well as a slew of reports from blue-chip companies, as we are heading to the center of the earnings season.
Volatility reigned supreme in some areas, as CNBC reported:
Wild swings resumed in heavily shorted stocks, including GameStop and AMC Entertainment, as enthusiastic retail investors active in chat rooms continued to bet against short-selling hedge funds. The volatility has some investors concerned about stocks becoming detached from fundamentals as speculation runs rampant.
As I have pounced on for years, fundamentals are no longer important, it is reckless and rampant speculation mixed with complacent and bubbly investor sentiment, all of which can potentially have a negative effect on the markets. But right now, “fear not,” seems to be the meme, “the Fed has our back and will do anything in their power to not let markets collapse.”
In the meantime, the Fed began its two-day meeting and tomorrow’s policy statement will be analyzed down to every word to be sure that any potential market rescue efforts remain in place.
While I am writing this, Microsoft just reported blowout earnings, which should bode well for the direction of the Nasdaq tomorrow.
Despite the major indexes being flat today, the biggest 3-day short squeeze since March/April last year pushed the most-shorted stocks back to record highs, as ZH reported.
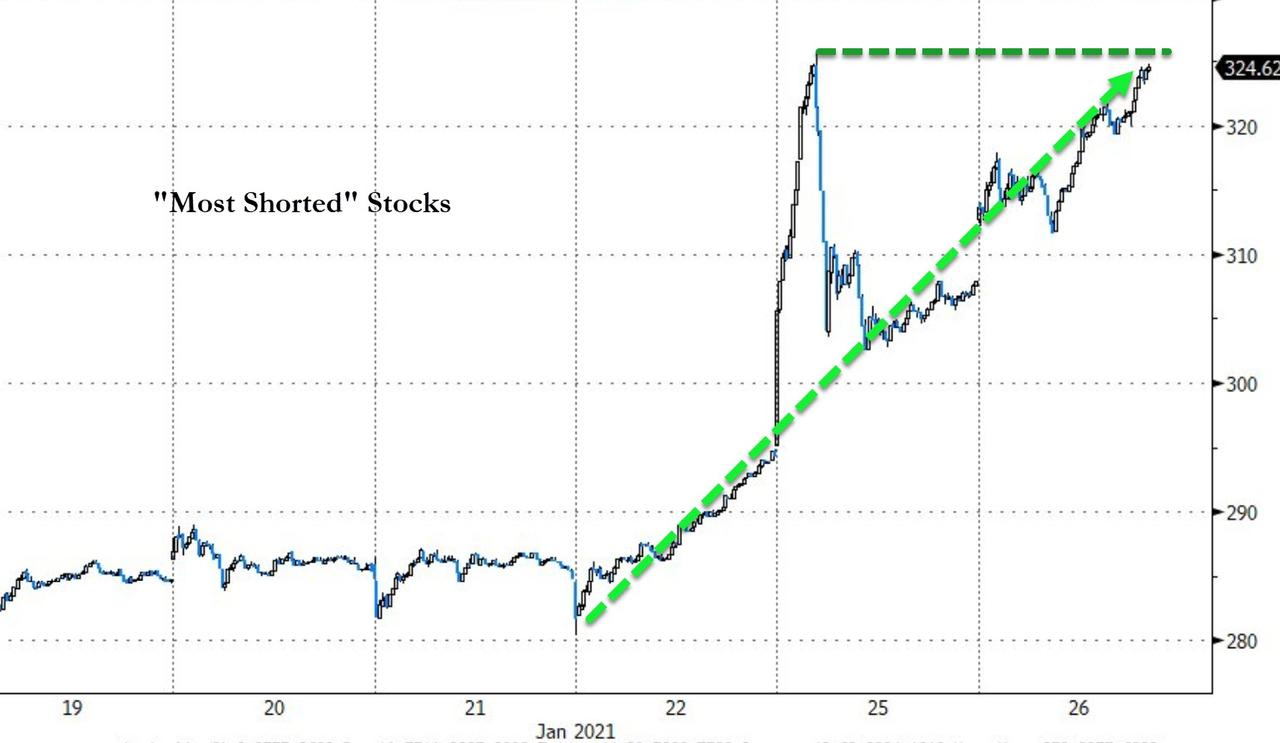
The US Dollar drifted lower, but Gold could not find the spark to use that weakness as a springboard for advances, so the precious metal remained stuck in its current trading range.
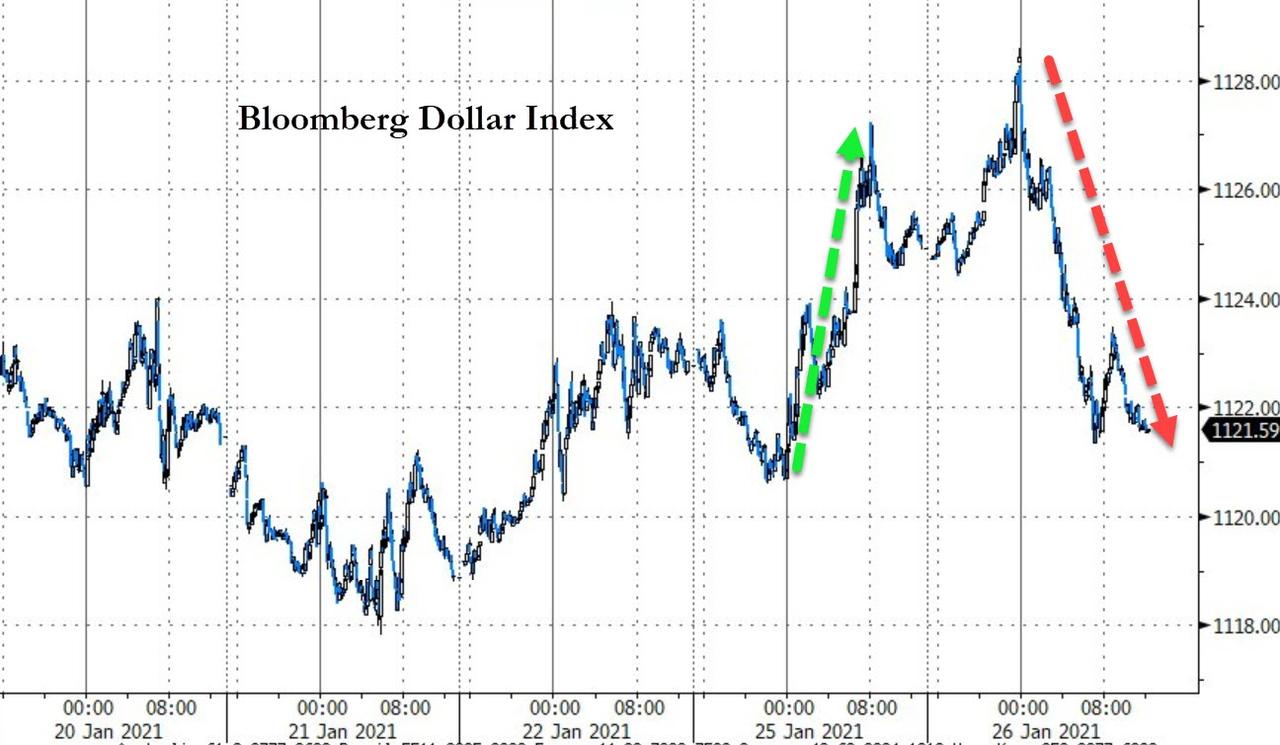
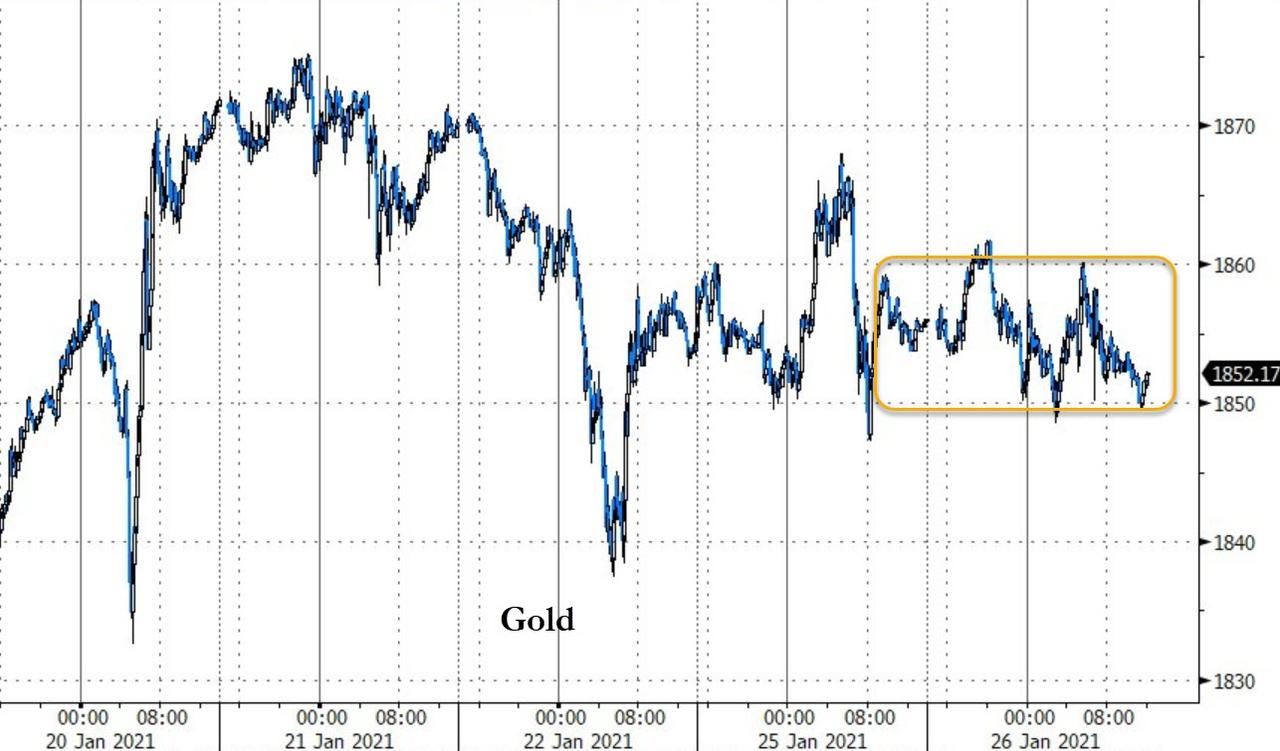
Oh well, tomorrow is another day.
2. ETFs in the Spotlight
In case you missed the announcement and description of this section, you can read it here again.
It features some of the 10 broadly diversified domestic and sector ETFs from my HighVolume list as posted every Saturday. Furthermore, they are screened for the lowest MaxDD% number meaning they have been showing better resistance to temporary sell offs than all others over the past year.
The below table simply demonstrates the magnitude with which these ETFs are fluctuating above or below their respective individual trend lines (%+/-M/A). A break below, represented by a negative number, shows weakness, while a break above, represented by a positive percentage, shows strength.
For hundreds of ETF choices, be sure to reference Thursday’s StatSheet.
For this current domestic “Buy” cycle, here’s how some our candidates have fared:
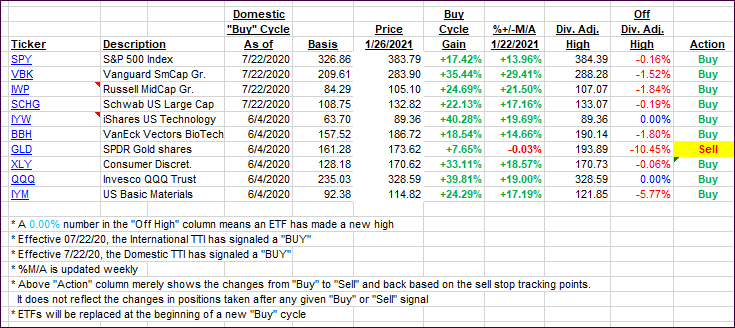
Click image to enlarge.
Again, the %+/-M/A column above shows the position of the various ETFs in relation to their respective long-term trend lines, while the trailing sell stops are being tracked in the “Off High” column. The “Action” column will signal a “Sell” once the -8% point has been taken out in the “Off High” column. For more volatile sector ETFs, the trigger point is -10%.
3. Trend Tracking Indexes (TTIs)
Our TTIs barely changed as the indexes were glued to the unchanged line.
This is how we closed 1/26/2021:
Domestic TTI: +17.68% above its M/A (prior close +18.26%)—Buy signal effective 07/22/2020.
International TTI: +16.65% above its M/A (prior close +16.65%)—Buy signal effective 07/22/2020.
Disclosure: I am obliged to inform you that I, as well as my advisory clients, own some of the ETFs listed in the above table. Furthermore, they do not represent a specific investment recommendation for you, they merely show which ETFs from the universe I track are falling within the specified guidelines.
Contact Ulli