
- Moving the markets
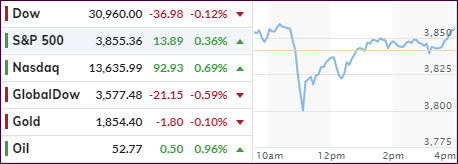
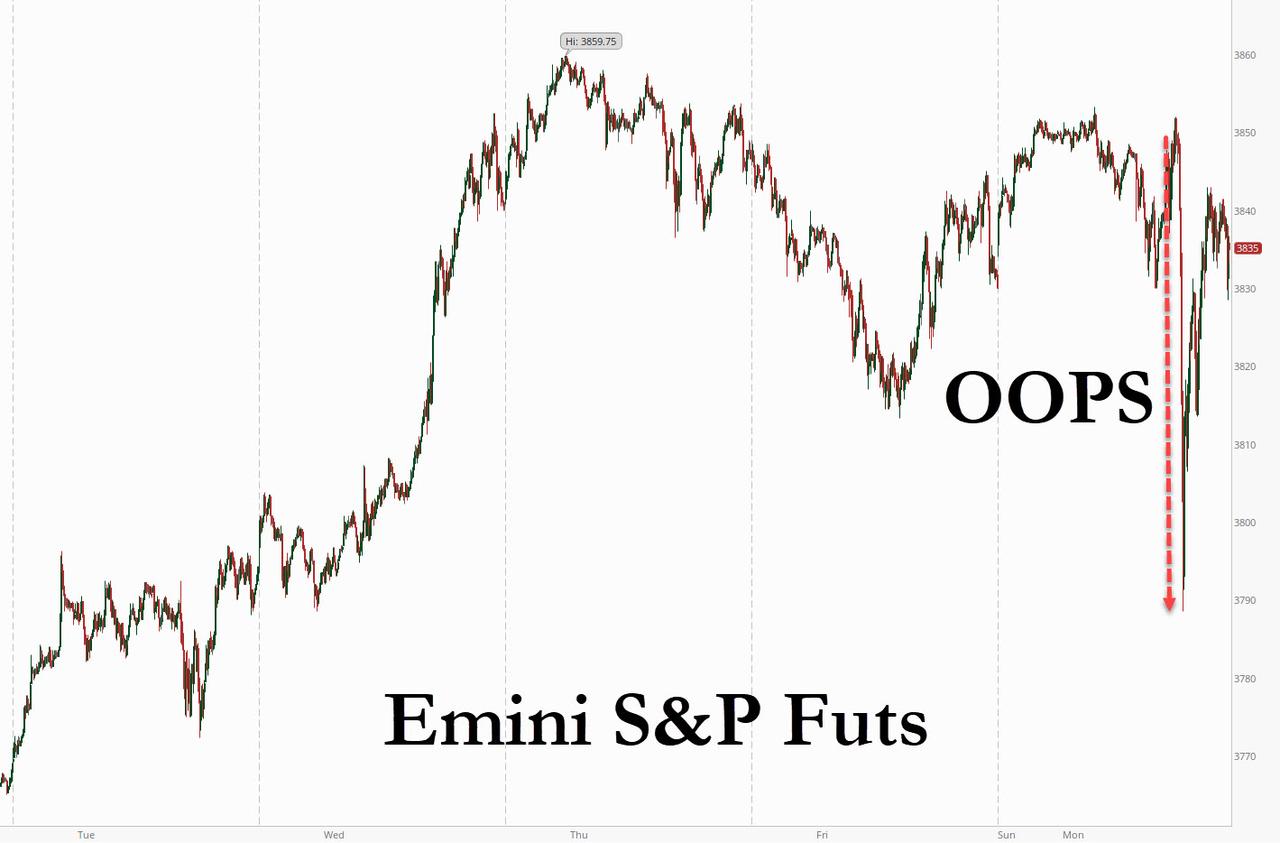
One look at the above chart tells you that an early excursion above the unchanged line came to a sudden halt, when the bottom dropped out with the major indexes doing their best imitation of a swan dive.
Even the Nasdaq, up early by +1.3% lost it all, crashed into the red, but managed to recover almost half of it, as the afternoon levitation pulled the major indexes out of the doldrums and towards green territory, with only the Dow failing to reach it.
Stimulus plan optimism fizzled somewhat after news that a bipartisan consortium was attempting to cut down the proposed $1.9 trillion figure. Adding to the sour mood were rising Covid cases and delays in vaccines supplies and distribution logistics.
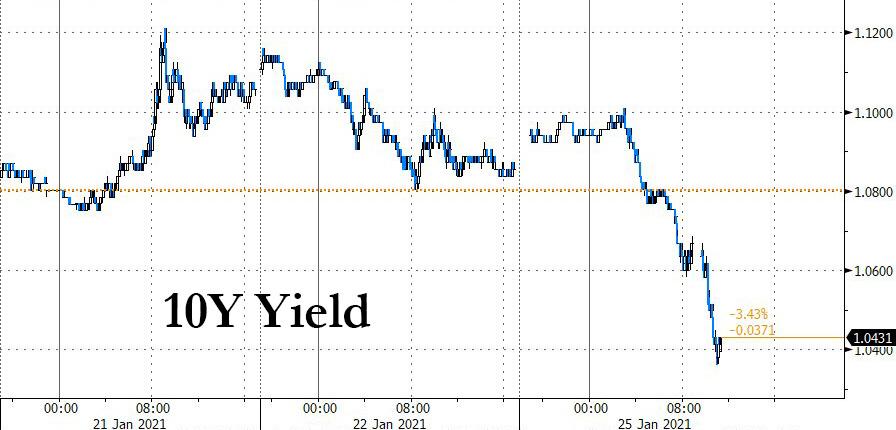
Still, I have to wonder if something broke in the markets this morning, since there was no known major event that might have caused the indexes to react like this and the 10-year yield plummeting like shown here.
Adding to this debacle were reports of investors having difficulty accessing their accounts with ZH summarizing it as follows:
- Robinhood is experiencing issues with crypto trading
- Vanguard tweeted it understands some clients are experiencing issues accessing their accounts
- TD Ameritrade says it is aware of an issue impacting a small number of clients on the thinkorswim platform, a company spokesperson said
- Charles Schwab announced it worked to resolve an issue
- There was a slowdown in Merrill logins earlier Monday, but the situation has been resolved, according to a Bank of America spokesperson
- E*Trade users reported problems Monday, according to Downdetector
Despite all that, the early trapdoor closed again, and the steady afternoon comeback pushed the S&P 500 up by +0.36%, a small margin, but large enough to register a new record.
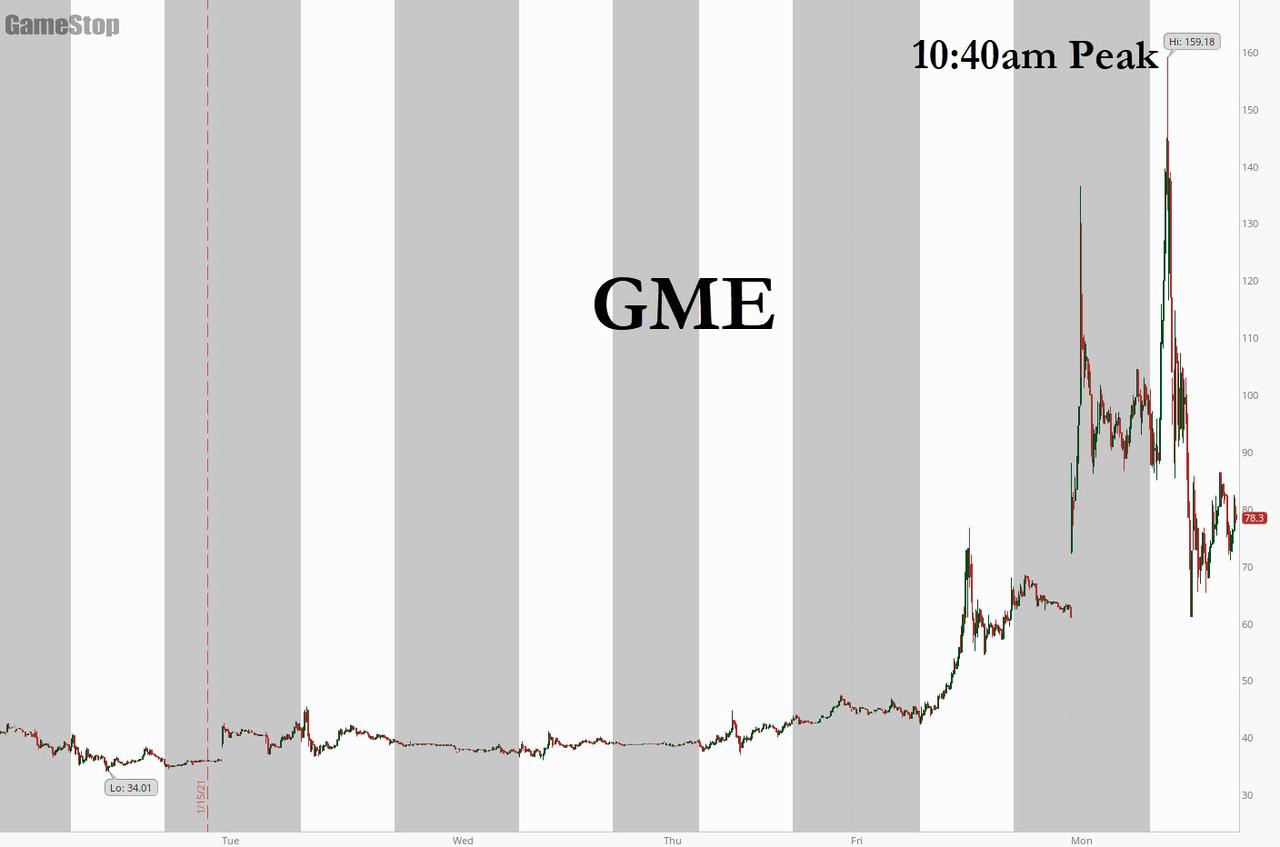
However, contributing to today’s volatility was a company called GME, which experienced an insane short squeeze leaving both, shorts and longs, scratching their head and wondering what happened. This chart shows the ride.
In terms of earnings, CNBC summed it up like this:
Companies kicked off the earnings season on a strong note. Of the S&P 500 components that have already reported earnings, 73% have beaten on both sales and EPS, according to data from Bank of America. The firm said this is tracking similar to last quarter when the number of companies beating hit a record.
I have talked about the dangers of sudden volatility before, and I am sure we have not seen the last of it.
2. ETFs in the Spotlight
In case you missed the announcement and description of this section, you can read it here again.
It features some of the 10 broadly diversified domestic and sector ETFs from my HighVolume list as posted every Saturday. Furthermore, they are screened for the lowest MaxDD% number meaning they have been showing better resistance to temporary sell offs than all others over the past year.
The below table simply demonstrates the magnitude with which these ETFs are fluctuating above or below their respective individual trend lines (%+/-M/A). A break below, represented by a negative number, shows weakness, while a break above, represented by a positive percentage, shows strength.
For hundreds of ETF choices, be sure to reference Thursday’s StatSheet.
For this current domestic “Buy” cycle, here’s how some our candidates have fared:
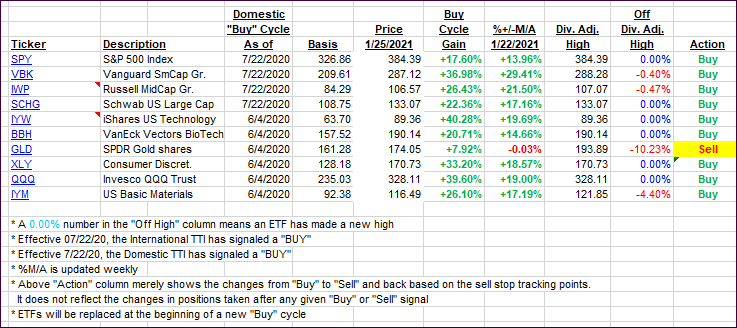
Click image to enlarge.
Again, the %+/-M/A column above shows the position of the various ETFs in relation to their respective long-term trend lines, while the trailing sell stops are being tracked in the “Off High” column. The “Action” column will signal a “Sell” once the -8% point has been taken out in the “Off High” column. For more volatile sector ETFs, the trigger point is -10%.
3. Trend Tracking Indexes (TTIs)
Our TTIs slipped by a small margin.
This is how we closed 1/25/2021:
Domestic TTI: +18.26% above its M/A (prior close +18.37%)—Buy signal effective 07/22/2020.
International TTI: +16.65% above its M/A (prior close +17.33%)—Buy signal effective 07/22/2020.
Disclosure: I am obliged to inform you that I, as well as my advisory clients, own some of the ETFs listed in the above table. Furthermore, they do not represent a specific investment recommendation for you, they merely show which ETFs from the universe I track are falling within the specified guidelines.
Contact Ulli