
- Moving the markets
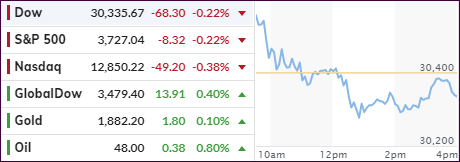
Despite the futures spiking into record territory, and the cash markets following suit at the opening, the major indexes ended up sliding lower, chopped around their respective trendlines, but fell short in their attempt to rebound into the green.
Taking the starch out of the early dash was the continued battle over the stimulus package with some Representatives favoring the increased direct payment to Americans of $2,000 from the previous $600, while others opposed it. The tug-of-war will go on until the deciding votes are cast.
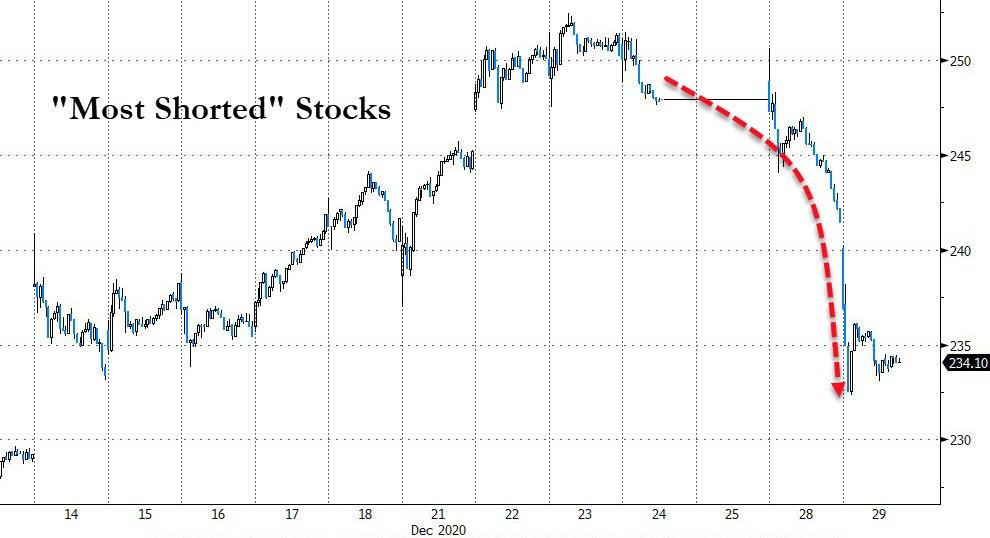
The clubbing of Small- and MidCaps continued, while the Dow and S&P 500 held up the best. The most shorted stocks, which had been relentlessly squeezed higher for most of the year, finally got hammered over the past few sessions.
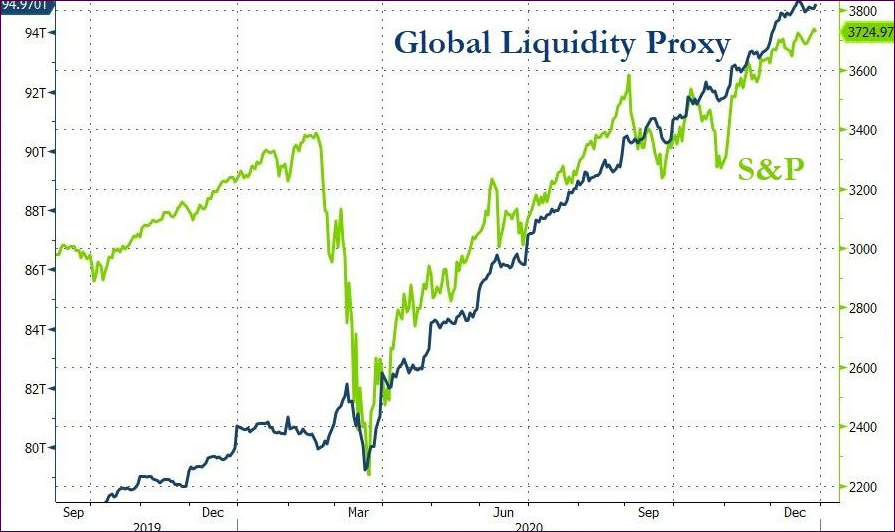
Gold in the end managed a green close but fell short of reaching its $1,900 marker. The bullish equity theme remains in full force, despite current weakness, as the driver of this magic rally has not shown any signs of slowing down—yet:
2. ETFs in the Spotlight
In case you missed the announcement and description of this section, you can read it here again.
It features some of the 10 broadly diversified domestic and sector ETFs from my HighVolume list as posted every Saturday. Furthermore, they are screened for the lowest MaxDD% number meaning they have been showing better resistance to temporary sell offs than all others over the past year.
The below table simply demonstrates the magnitude with which these ETFs are fluctuating above or below their respective individual trend lines (%+/-M/A). A break below, represented by a negative number, shows weakness, while a break above, represented by a positive percentage, shows strength.
For hundreds of ETF choices, be sure to reference Thursday’s StatSheet.
For this current domestic “Buy” cycle, here’s how some our candidates have fared:
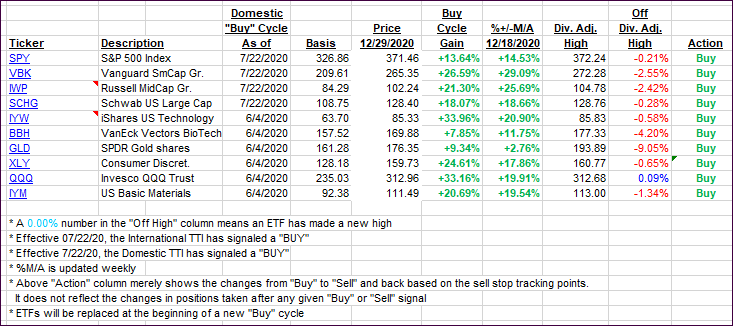
Click image to enlarge
Again, the %+/-M/A column above shows the position of the various ETFs in relation to their respective long-term trend lines, while the trailing sell stops are being tracked in the “Off High” column. The “Action” column will signal a “Sell” once the -8% point has been taken out in the “Off High” column. For more volatile sector ETFs, the trigger point is -10%.
3. Trend Tracking Indexes (TTIs)
Our TTIs were mixed with the International one showing more strength than its Domestic cousin.
This is how we closed 12/29/2020:
Domestic TTI: +18.76% above its M/A (prior close +19.36%)—Buy signal effective 07/22/2020
International TTI: +18.61% above its M/A (prior close +18.15%)—Buy signal effective 07/22/2020
Disclosure: I am obliged to inform you that I, as well as my advisory clients, own some of the ETFs listed in the above table. Furthermore, they do not represent a specific investment recommendation for you, they merely show which ETFs from the universe I track are falling within the specified guidelines.
Contact Ulli