
- Moving the markets
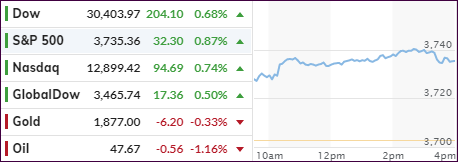
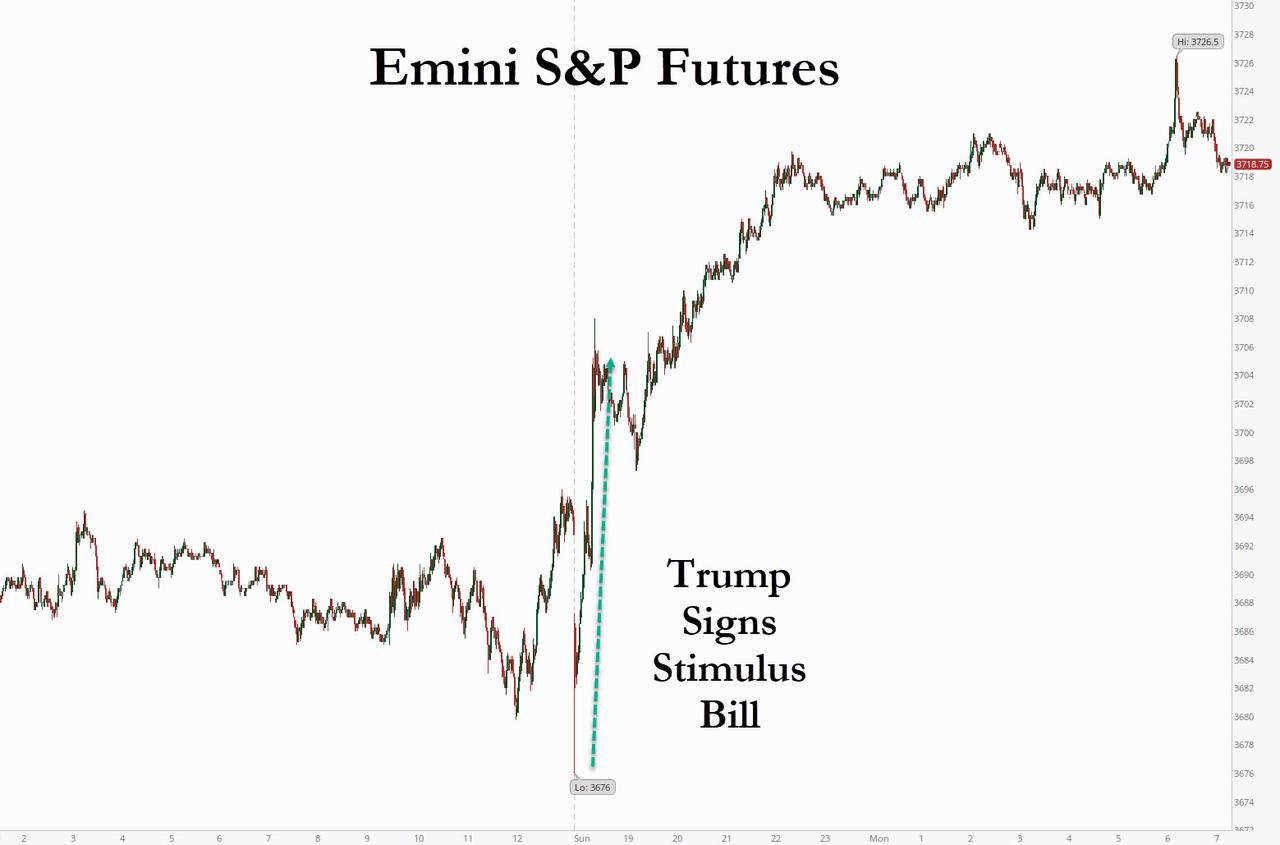
Global stocks and US equity futures leaped as a result of Trump signing the $2.3 trillion spending package, while euphoria reigned supreme in the UK, as a last-minute trade deal with the EU was signed.
Here’s CNBC:
Trump signed a $900 billion Covid-19 relief bill into law, averting a government shutdown and extending unemployment benefits to millions of Americans. The signing came days after Trump suggested he would veto the legislation, demanding $2,000 direct payments to Americans, instead of $600. The House is expected to vote on a $2,000 direct payment on Monday, but the GOP-led Senate is not expected to push it through.
This added encouragement to the Wall Street crowd, as it now appears that the current rally may have legs and could continue into the near future. The reason is, as analyst Tom Essaye pointed out, that the main support pillars are still in place, namely Federal Stimulus, FOMC stimulus, vaccine rollout, a divided government, and no double-dip recession, although I beg to differ on the last point.
Still, the rally predominantly included the major indexes, while the recent performance darlings, Small- and MidCaps, took a breather and gave back some of their latest sharp gains.
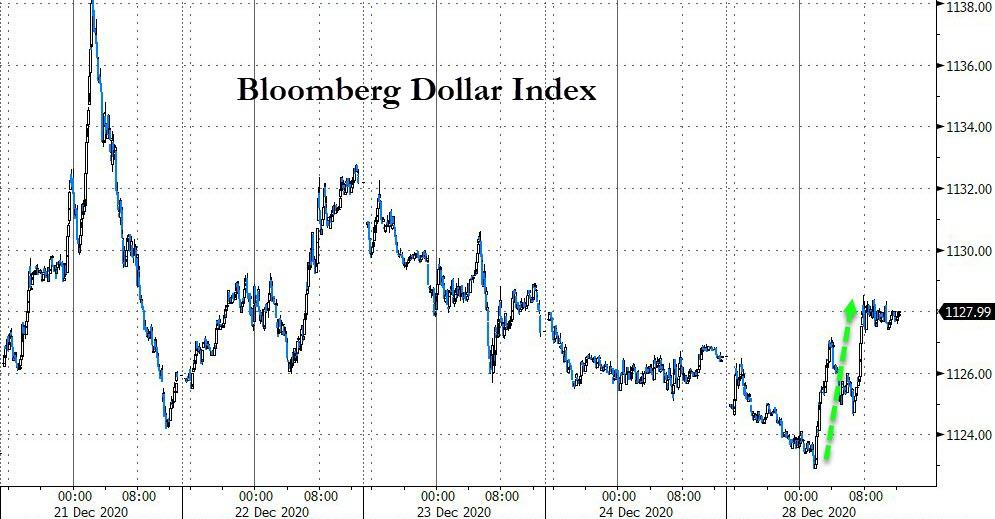
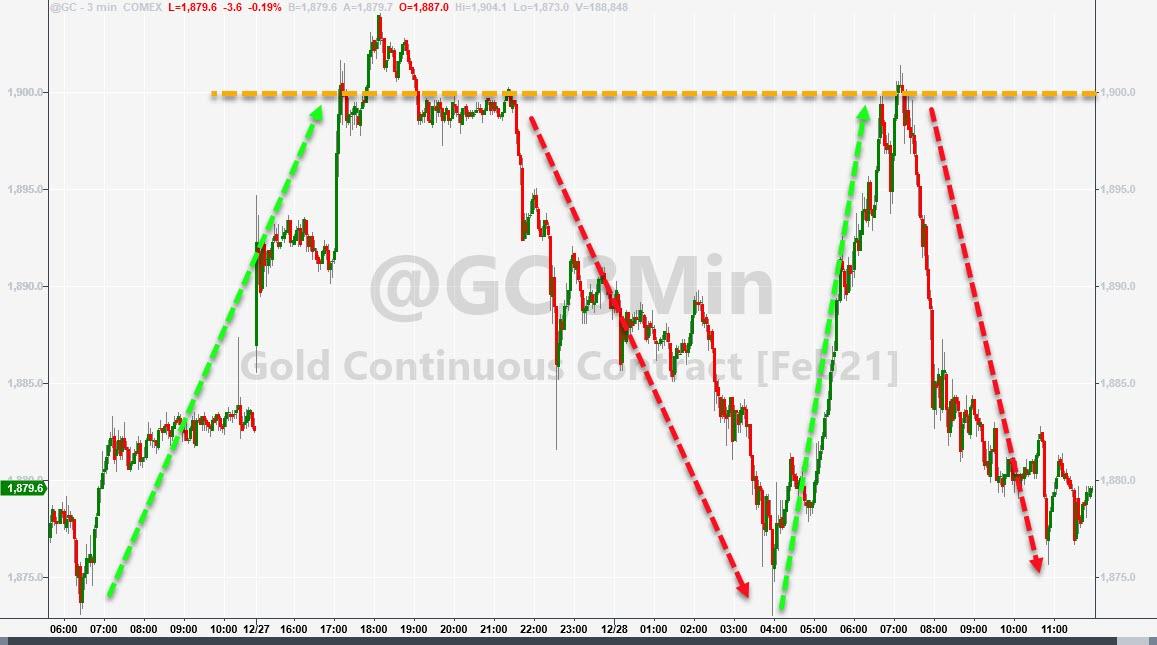
The US Dollar index rose for a change, while gold, after an early bounce towards the $1,900 level, ended up giving it all back.
As I keep posting, nothing makes sense, especially the markets pumping while underlying Macro Data are dumping, as Bloomberg points to in this chart:
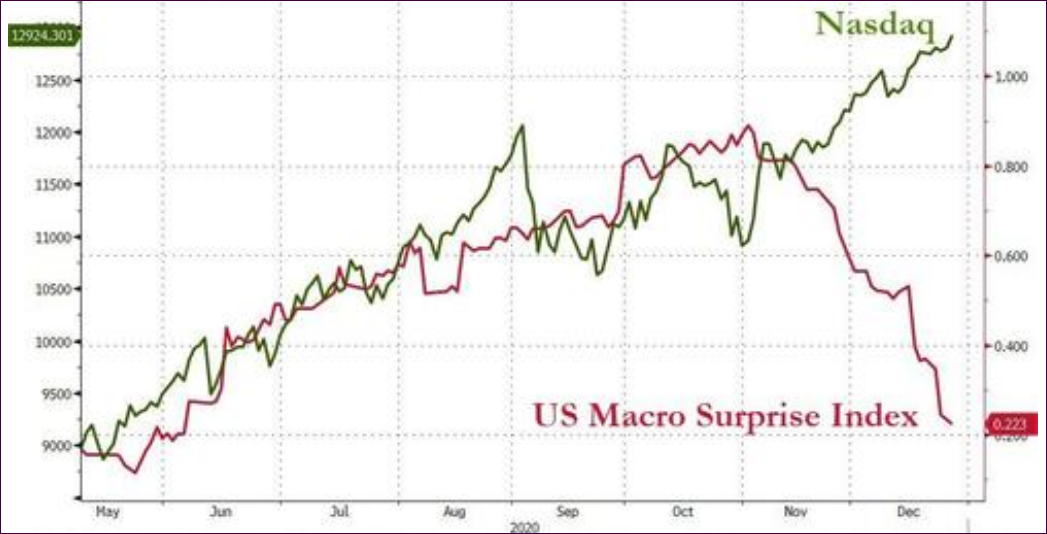
Makes me wonder how long this can go on before the jaws of reality finally snap shut.
2. ETFs in the Spotlight
In case you missed the announcement and description of this section, you can read it here again.
It features some of the 10 broadly diversified domestic and sector ETFs from my HighVolume list as posted every Saturday. Furthermore, they are screened for the lowest MaxDD% number meaning they have been showing better resistance to temporary sell offs than all others over the past year.
The below table simply demonstrates the magnitude with which these ETFs are fluctuating above or below their respective individual trend lines (%+/-M/A). A break below, represented by a negative number, shows weakness, while a break above, represented by a positive percentage, shows strength.
For hundreds of ETF choices, be sure to reference Thursday’s StatSheet.
For this current domestic “Buy” cycle, here’s how some our candidates have fared:
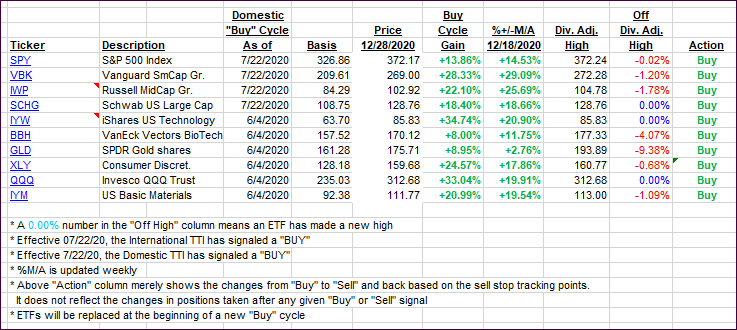
Click image to enlarge
Again, the %+/-M/A column above shows the position of the various ETFs in relation to their respective long-term trend lines, while the trailing sell stops are being tracked in the “Off High” column. The “Action” column will signal a “Sell” once the -8% point has been taken out in the “Off High” column. For more volatile sector ETFs, the trigger point is -10%.
3. Trend Tracking Indexes (TTIs)
Our TTIs edged up slightly.
This is how we closed 12/28/2020:
Domestic TTI: +19.36% above its M/A (prior close +19.00%)—Buy signal effective 07/22/2020
International TTI: +18.15% above its M/A (prior close +17.54%)—Buy signal effective 07/22/2020
Disclosure: I am obliged to inform you that I, as well as my advisory clients, own some of the ETFs listed in the above table. Furthermore, they do not represent a specific investment recommendation for you, they merely show which ETFs from the universe I track are falling within the specified guidelines.
Contact Ulli