
- Moving the markets
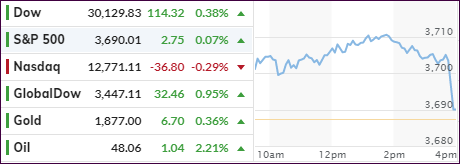
The futures already whipsawed on Trump’s decision to return the stimulus bill to Congress, as it contained billions in unacceptable pork expenditures. The initial drop quickly reversed and, by the time the regular session opened, the major indexes were already in rally mode, except for the Nasdaq, which lagged all day.
However, a dive into the close pushed the tech sector into the red, but the Dow and S&P managed to hang on to some modest increases along with SmallCaps.
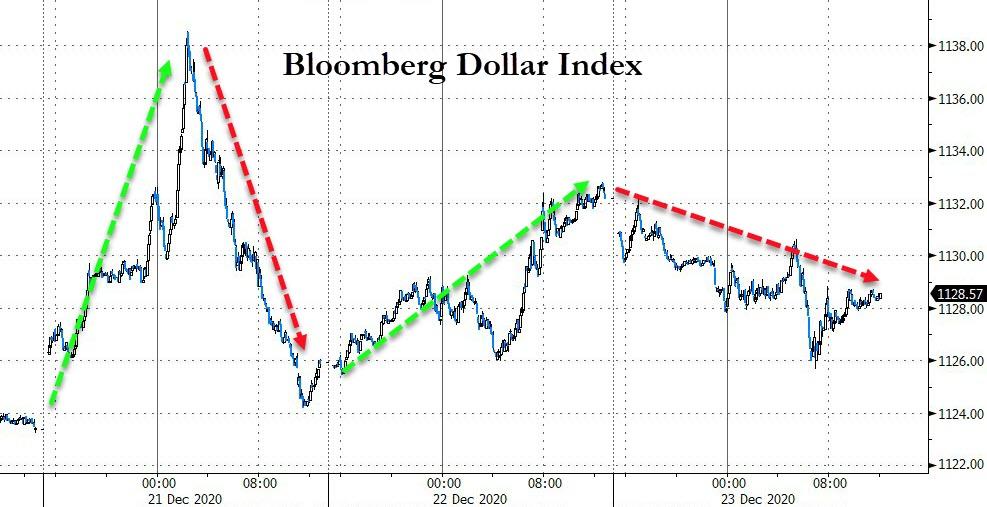
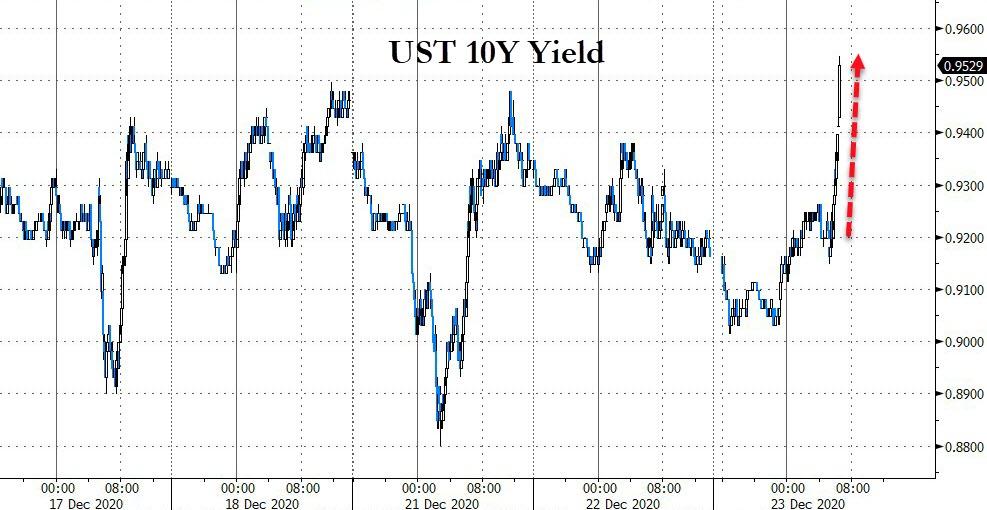
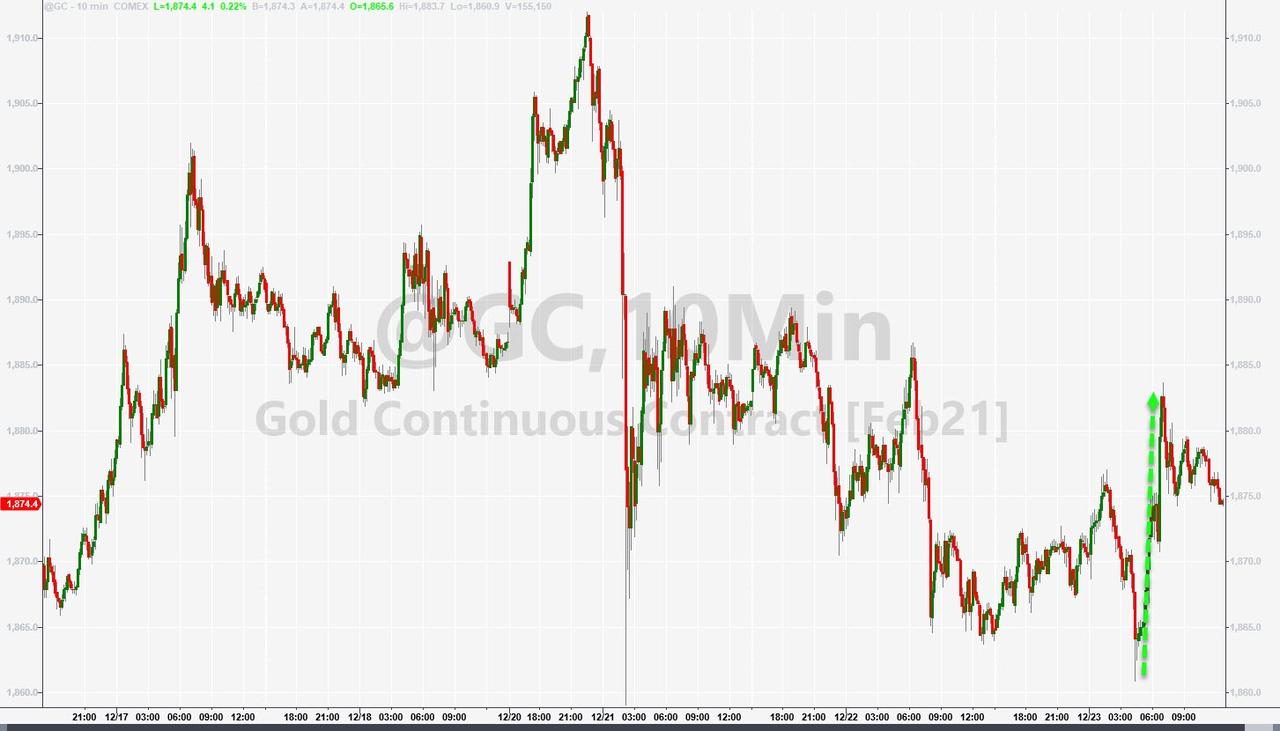
The Dollar index fell, US bond yields rose, and gold finally eked out a gain of +0.34%
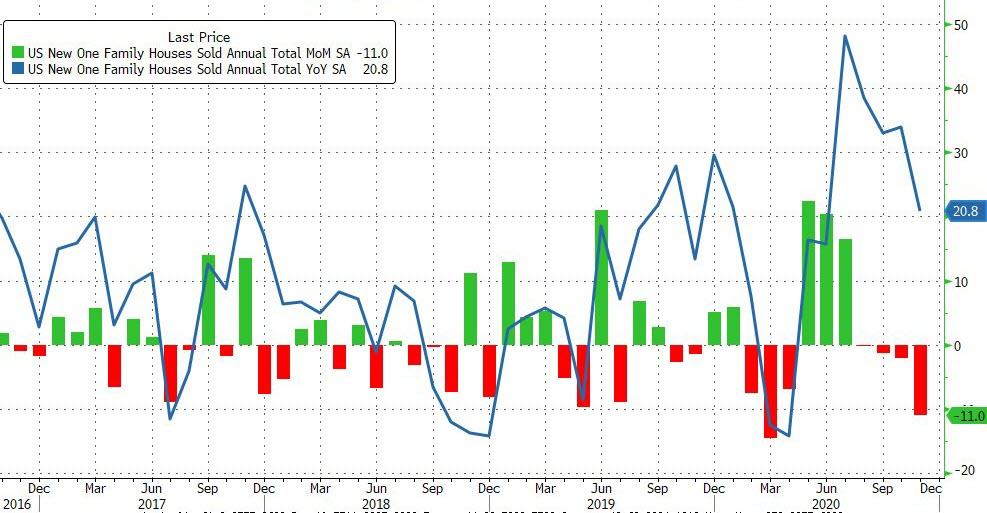
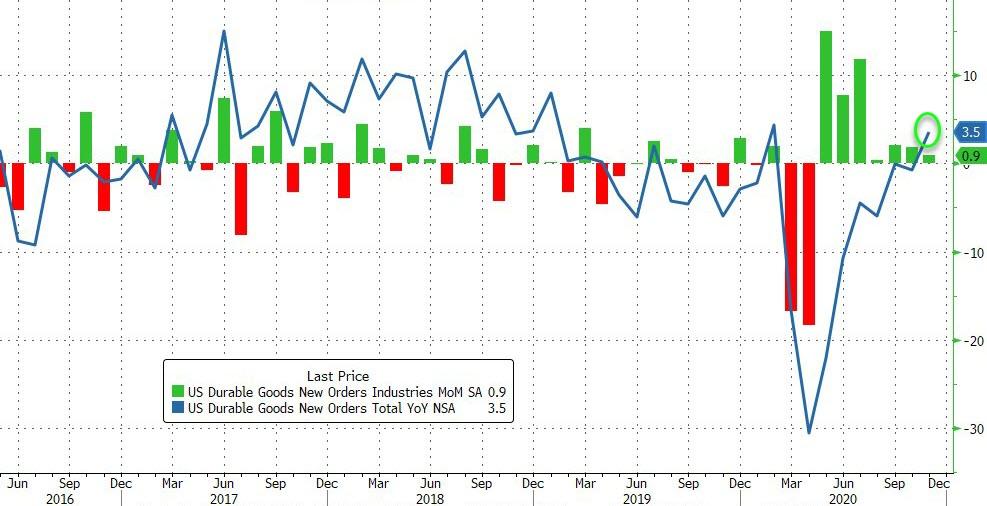
Economic indicators were mixed with New Home Sales puking by 11% MoM in November, Durable Goods orders surging back into the green for the year, and Initial Jobless Claims improving to ONLY 803k new filings, which is down from the prior month’s upwardly revised 892k. Be that as it may, it does not represent an economy in recovery mode.
Adding all the econ data up, ZH seems to agree:
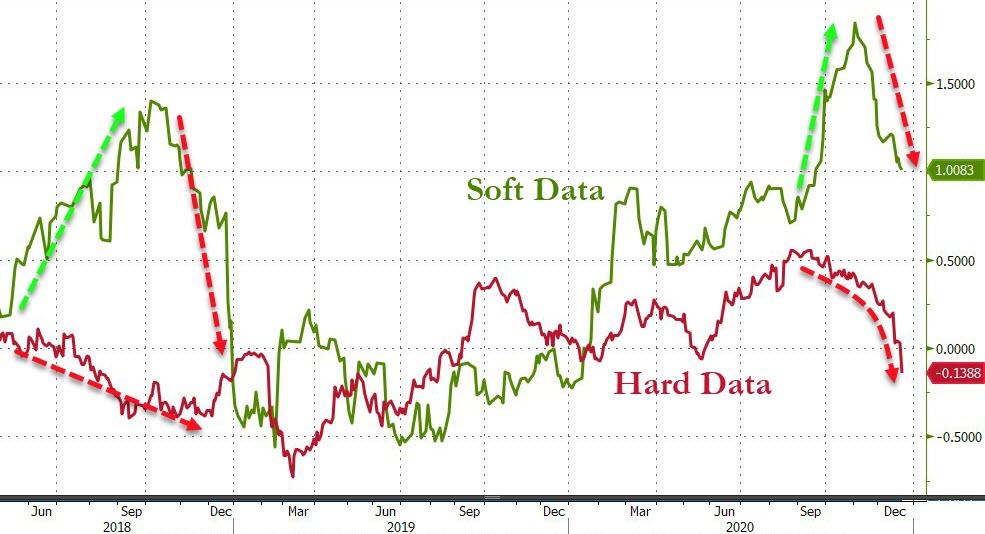
Core Durable Goods miss, Personal Income and Spending miss and drop, UMich Sentiment miss and drop, total jobless claims remain above 20 million, and new home sales miss and drop… all sending hard and soft macro data plunging…
And this chart by Bloomberg confirms it.
Tomorrow will be a short trading day with the markets closing at 10 am PST. I will be out for the rest of this week and will return on Monday with the latest market commentary.
Merry Christmas to you.
Ulli…
2. ETFs in the Spotlight
In case you missed the announcement and description of this section, you can read it here again.
It features some of the 10 broadly diversified domestic and sector ETFs from my HighVolume list as posted every Saturday. Furthermore, they are screened for the lowest MaxDD% number meaning they have been showing better resistance to temporary sell offs than all others over the past year.
The below table simply demonstrates the magnitude with which these ETFs are fluctuating above or below their respective individual trend lines (%+/-M/A). A break below, represented by a negative number, shows weakness, while a break above, represented by a positive percentage, shows strength.
For hundreds of ETF choices, be sure to reference Thursday’s StatSheet.
For this current domestic “Buy” cycle, here’s how some our candidates have fared:
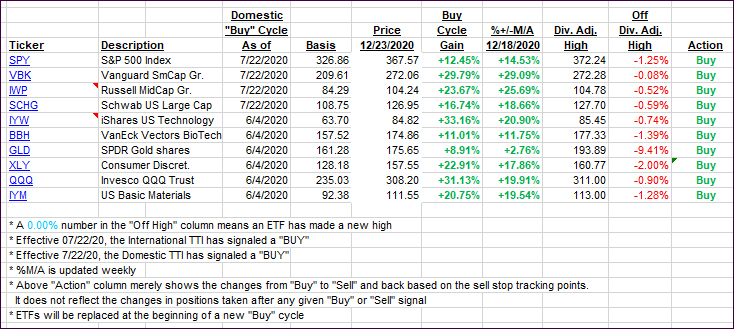
Click image to enlarge
Again, the %+/-M/A column above shows the position of the various ETFs in relation to their respective long-term trend lines, while the trailing sell stops are being tracked in the “Off High” column. The “Action” column will signal a “Sell” once the -8% point has been taken out in the “Off High” column. For more volatile sector ETFs, the trigger point is -10%.
3. Trend Tracking Indexes (TTIs)
Our TTIs barely changed as an early rally corrected into the close.
This is how we closed 12/23/2020:
Domestic TTI: +18.77% above its M/A (prior close +18.54%)—Buy signal effective 07/22/2020
International TTI: +17.52% above its M/A (prior close +17.05%)—Buy signal effective 07/22/2020
Disclosure: I am obliged to inform you that I, as well as my advisory clients, own some of the ETFs listed in the above table. Furthermore, they do not represent a specific investment recommendation for you, they merely show which ETFs from the universe I track are falling within the specified guidelines.
Contact Ulli