
- Moving the markets
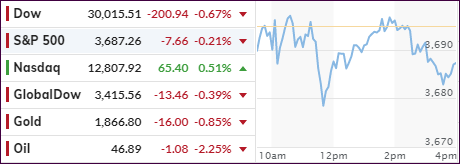
For the 3rd day in a row, the S&P 500 meandered aimlessly and ended up in red territory again but by a modest amount. Even the arrival and passing of the long-awaited Covid stimulus deal could not generate any buying enthusiasm for the major indexes.
However, the Nasdaq bucked the trend, but was easily outperformed by Small- and Midcap ETFs with gains of +1.86% and +1.01% respectively. Consumer confidence tumbled to 4-month lows and banks were a hindrance for the Dow.
The focus today was on the $900 billion pandemic aid bundle, which was attached to a $1.4 trillion package to keep the government funded through September 30th. Trump is expected to sign it into law within a few days. Unfortunately, the entire deal contains a lot of pork, as ZH outlines in this post.
The sour mood in the markets was a result of more bad news about a new virus strain, which so far has shut down and isolated the UK from most of the world. Many European countries enacted severe travel restrictions on visitors from the UK and some trade shipments have been interrupted.
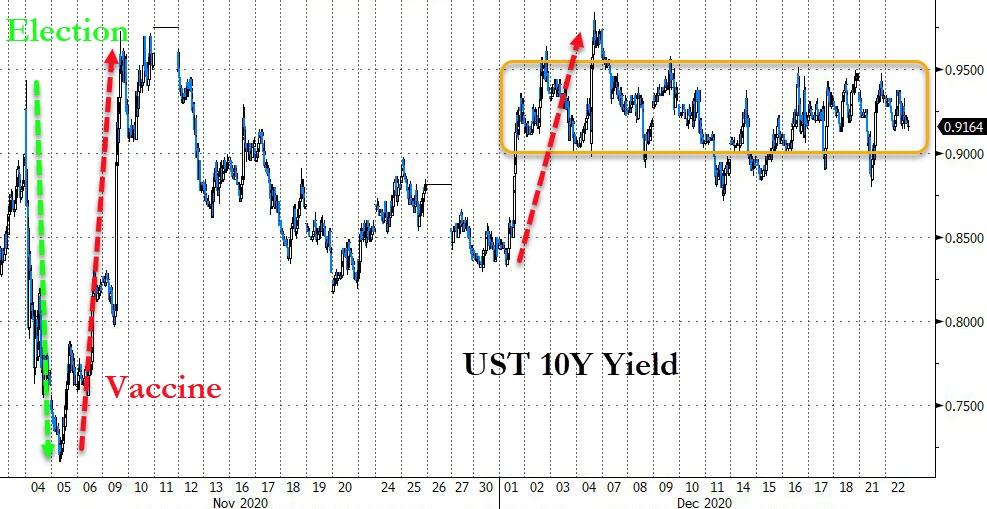
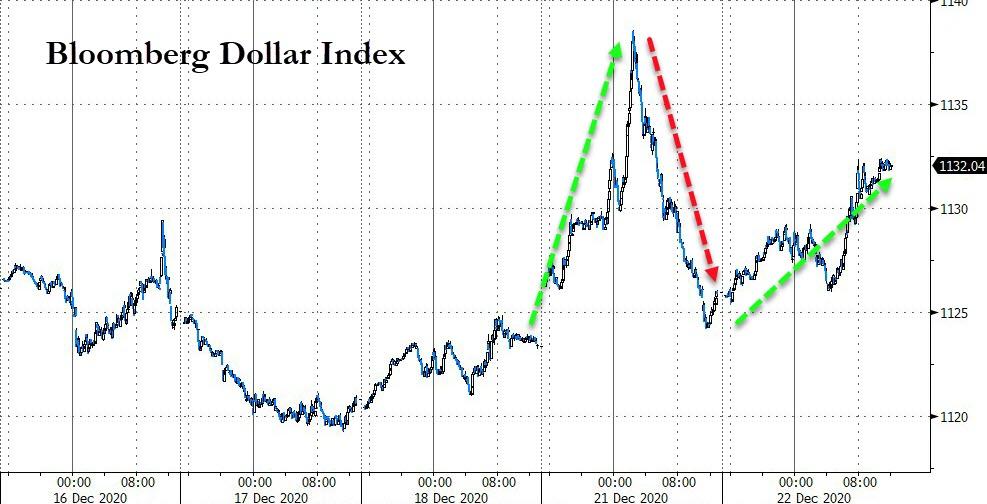
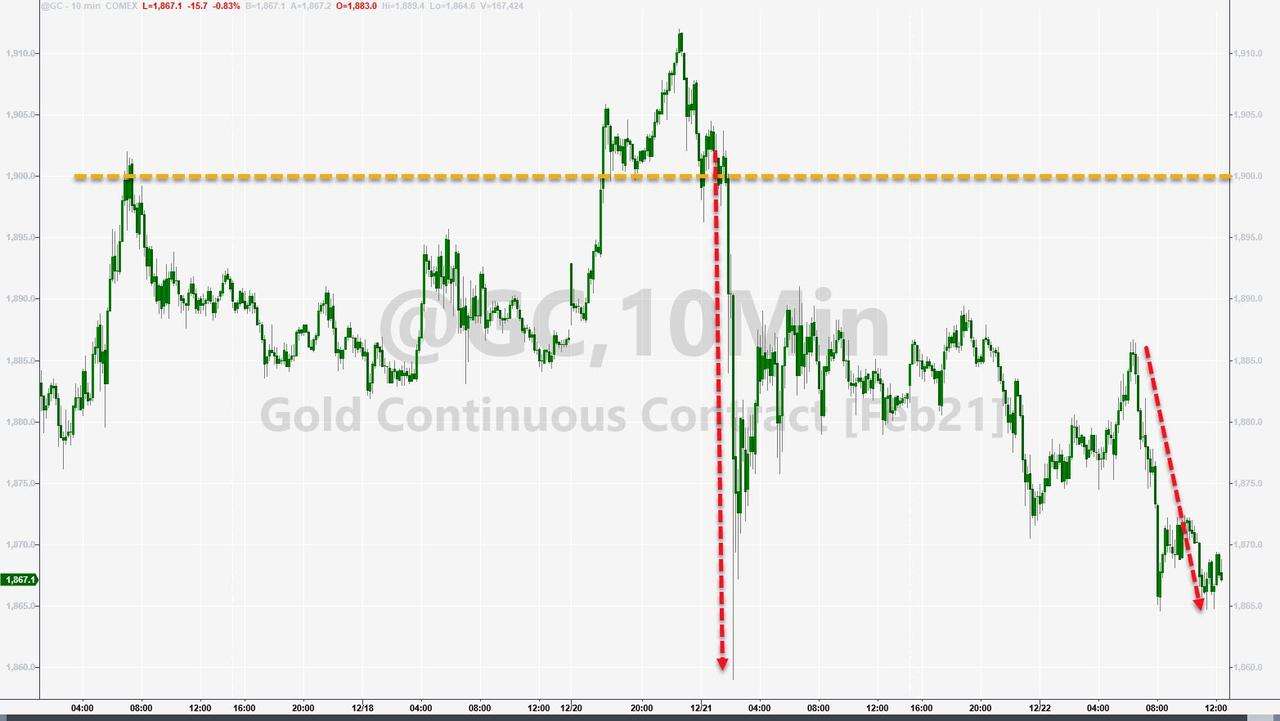
Bond yields went sideways, but the US Dollar Index found some strength, thereby preventing gold from staging a rebound.
I expect similar action on reduced volume not only tomorrow but also during the abbreviated session on Thursday.
2. ETFs in the Spotlight
In case you missed the announcement and description of this section, you can read it here again.
It features some of the 10 broadly diversified domestic and sector ETFs from my HighVolume list as posted every Saturday. Furthermore, they are screened for the lowest MaxDD% number meaning they have been showing better resistance to temporary sell offs than all others over the past year.
The below table simply demonstrates the magnitude with which these ETFs are fluctuating above or below their respective individual trend lines (%+/-M/A). A break below, represented by a negative number, shows weakness, while a break above, represented by a positive percentage, shows strength.
For hundreds of ETF choices, be sure to reference Thursday’s StatSheet.
For this current domestic “Buy” cycle, here’s how some our candidates have fared:
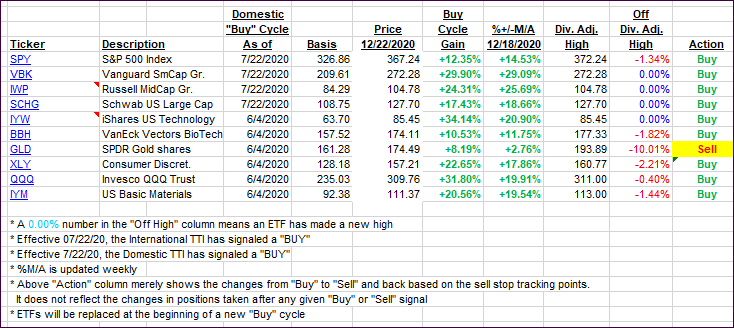
Click image to enlarge
Again, the %+/-M/A column above shows the position of the various ETFs in relation to their respective long-term trend lines, while the trailing sell stops are being tracked in the “Off High” column. The “Action” column will signal a “Sell” once the -8% point has been taken out in the “Off High” column. For more volatile sector ETFs, the trigger point is -10%.
3. Trend Tracking Indexes (TTIs)
Our TTIs pulled back a tad as the S&P 500 slipped along with the Dow.
This is how we closed 12/22/2020:
Domestic TTI: +18.08% above its M/A (prior close +18.54%)—Buy signal effective 07/22/2020
International TTI: +16.44% above its M/A (prior close +17.05%)—Buy signal effective 07/22/2020
Disclosure: I am obliged to inform you that I, as well as my advisory clients, own some of the ETFs listed in the above table. Furthermore, they do not represent a specific investment recommendation for you, they merely show which ETFs from the universe I track are falling within the specified guidelines.
Contact Ulli