
- Moving the markets
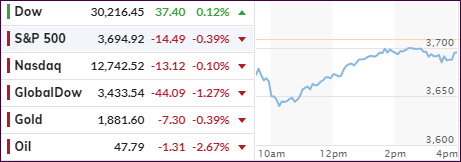
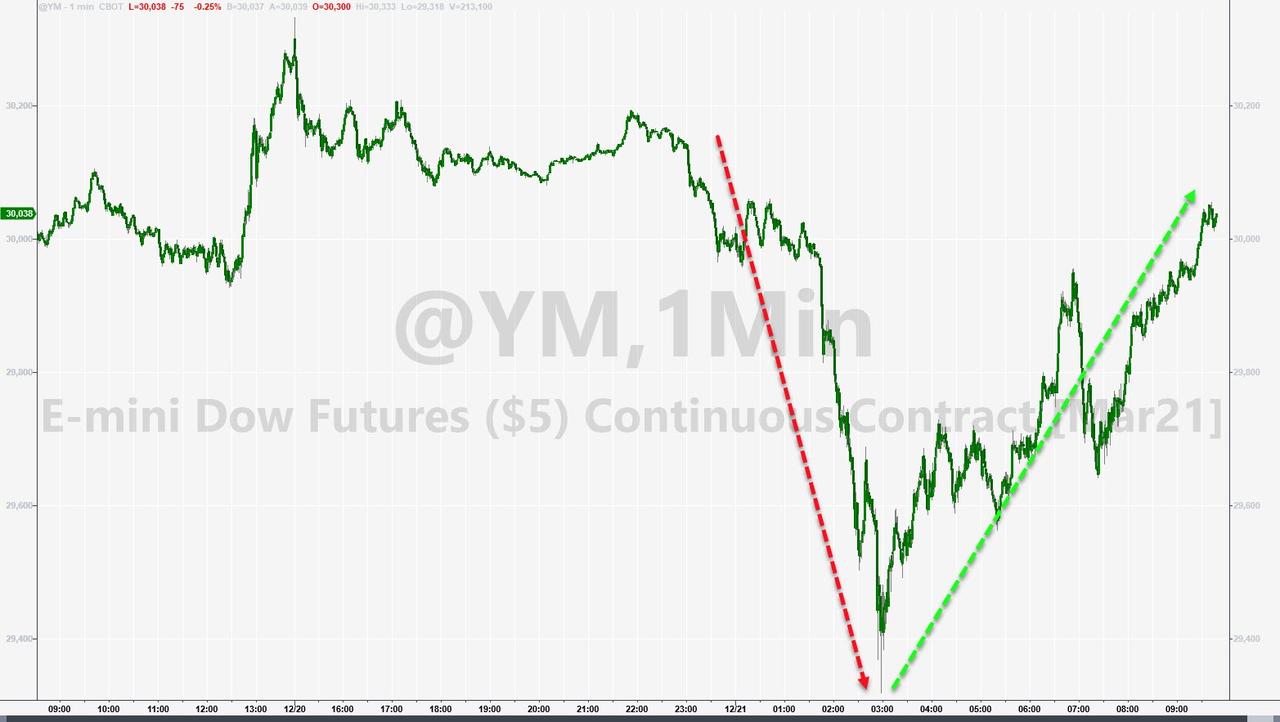
An early 400-point drop in the Dow, caused by fears about a new Covid strain, created a deep hole for the markets but, as if by magic, a sudden turnaround materialized. The major indexes reversed with the Dow completing a trading range of some 800 points.
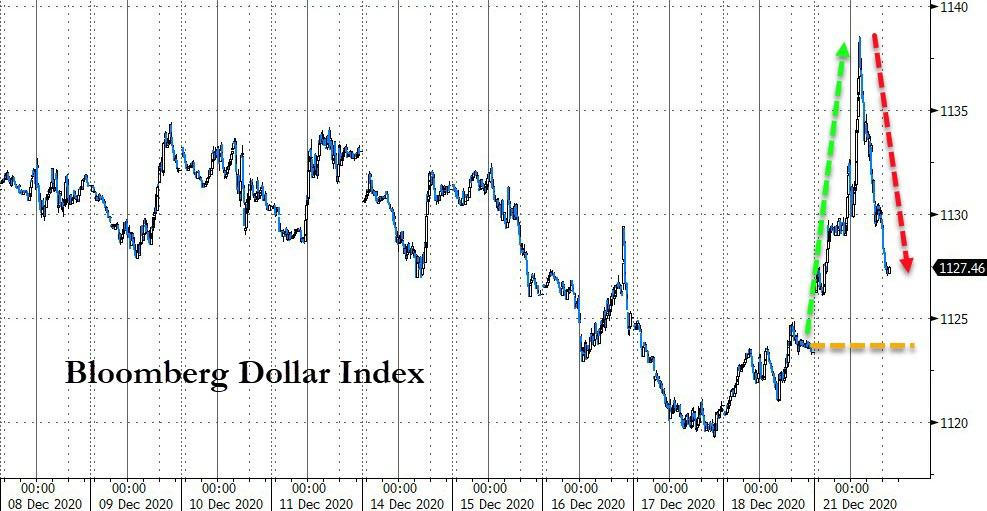
It appears that the $900 billion agreed upon stimulus bill lent a huge assist, yet it punished the US Dollar, which had spiked on the early equity drop, but ended up wiping out most of its early gains.
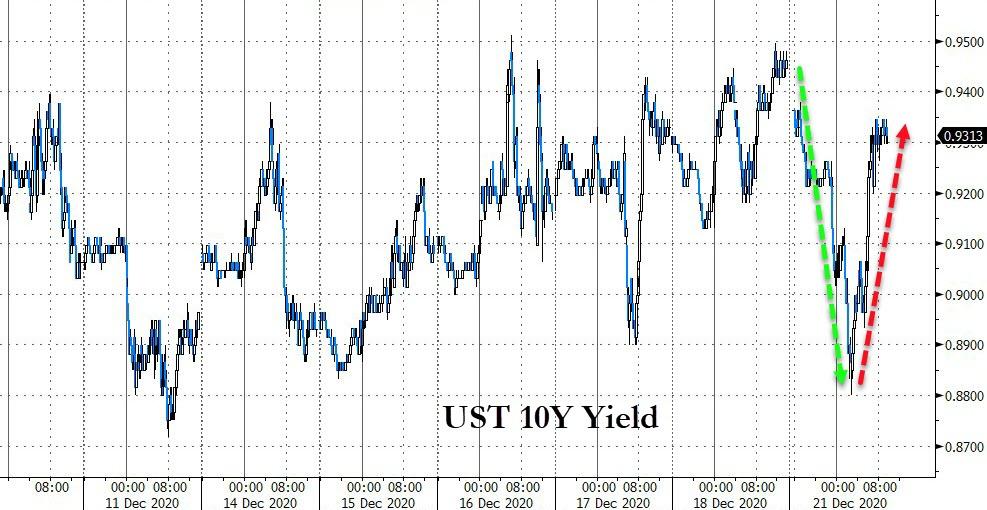
This volatility carried over into bond land, where the 10-year yield first fell and then spiked. Of course, Steve Mnuchin’s “calming the market appearance” on CNBC, during which he uttered nothing new, was enough to stimulate a buying stampede shifting the computer algos into overdrive.
Equities also received indirect support from a rallying banking sector due to the Fed allowing banks to again engage in buyback activities after a recent stress test.
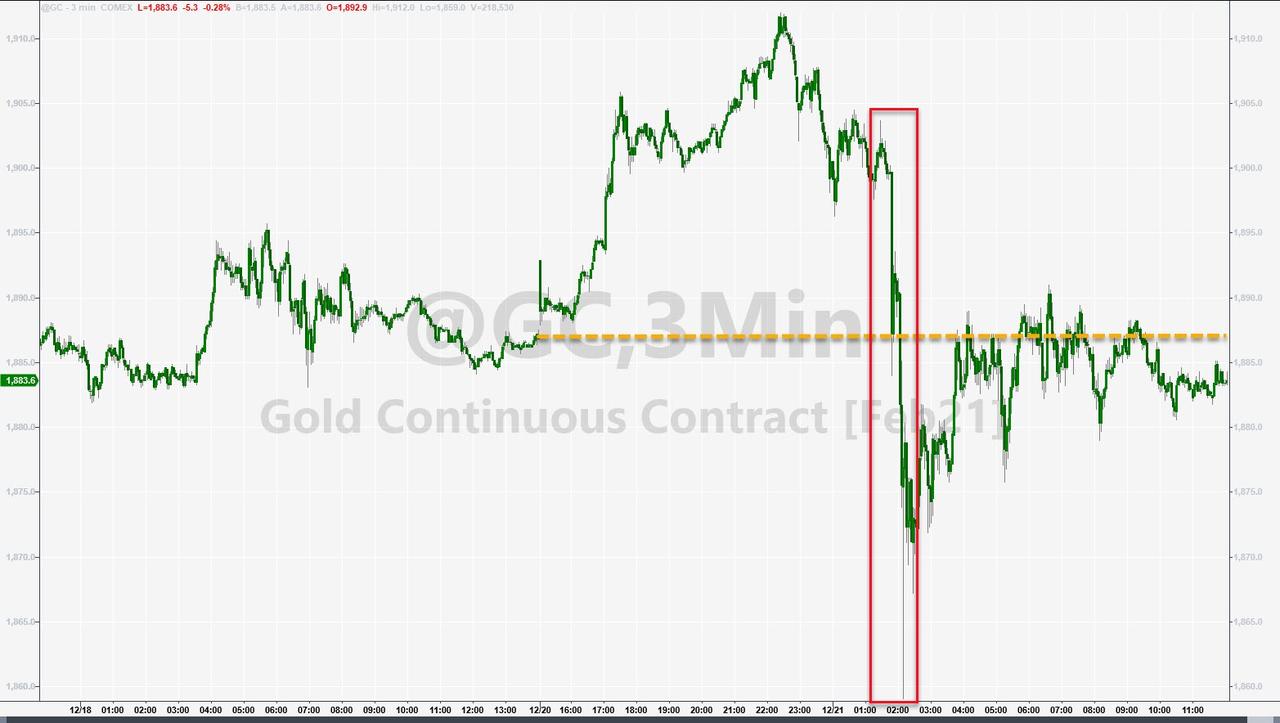
In the end, it was only the Dow which managed to crawl back above its unchanged line for the day but given the magnitude of the early dump, the losses were moderate for the day. Gold pumped overnight but was not able to hang on to those initial gains.
2. ETFs in the Spotlight
In case you missed the announcement and description of this section, you can read it here again.
It features some of the 10 broadly diversified domestic and sector ETFs from my HighVolume list as posted every Saturday. Furthermore, they are screened for the lowest MaxDD% number meaning they have been showing better resistance to temporary sell offs than all others over the past year.
The below table simply demonstrates the magnitude with which these ETFs are fluctuating above or below their respective individual trend lines (%+/-M/A). A break below, represented by a negative number, shows weakness, while a break above, represented by a positive percentage, shows strength.
For hundreds of ETF choices, be sure to reference Thursday’s StatSheet.
For this current domestic “Buy” cycle, here’s how some our candidates have fared:
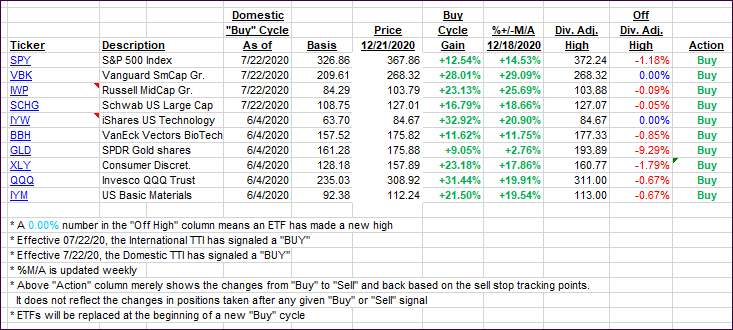
Click image to enlarge
Again, the %+/-M/A column above shows the position of the various ETFs in relation to their respective long-term trend lines, while the trailing sell stops are being tracked in the “Off High” column. The “Action” column will signal a “Sell” once the -8% point has been taken out in the “Off High” column. For more volatile sector ETFs, the trigger point is -10%.
3. Trend Tracking Indexes (TTIs)
Our TTIs slid as the major indexes were not able to recover all their early losses.
This is how we closed 12/21/2020:
Domestic TTI: +18.54% above its M/A (prior close +19.91%)—Buy signal effective 07/22/2020
International TTI: +17.05% above its M/A (prior close +18.62%)—Buy signal effective 07/22/2020
Disclosure: I am obliged to inform you that I, as well as my advisory clients, own some of the ETFs listed in the above table. Furthermore, they do not represent a specific investment recommendation for you, they merely show which ETFs from the universe I track are falling within the specified guidelines.
Contact Ulli