
- Moving the markets
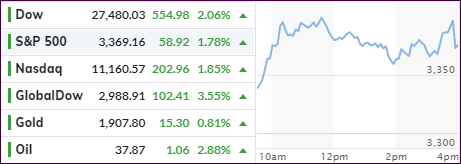
Yesterday’s rally continued based on hopes that a clear winner would emerge from today’s election and that a much-feared contested result could be avoided.
MarketWatch saw it this way:
The bounce back from the worst week since March is supported by bets former Vice President Joe Biden will beat incumbent President Donald Trump, and Democrats at the same time will take control of Congress, raising the possibility of further financial relief for businesses and individuals stricken by the COVID-19 pandemic, analysts said.
Of course, the opposite outcome is presented via headlines like this:
“JPMorgan Sees S&P Tumbling To 2,500 In Case Of Blue Wave, Surging To 3,900 If Red Wave”
Most shorted stocks were squeezed thereby adding power to the rally, with SmallCaps leading the way, closely followed by the Dow.
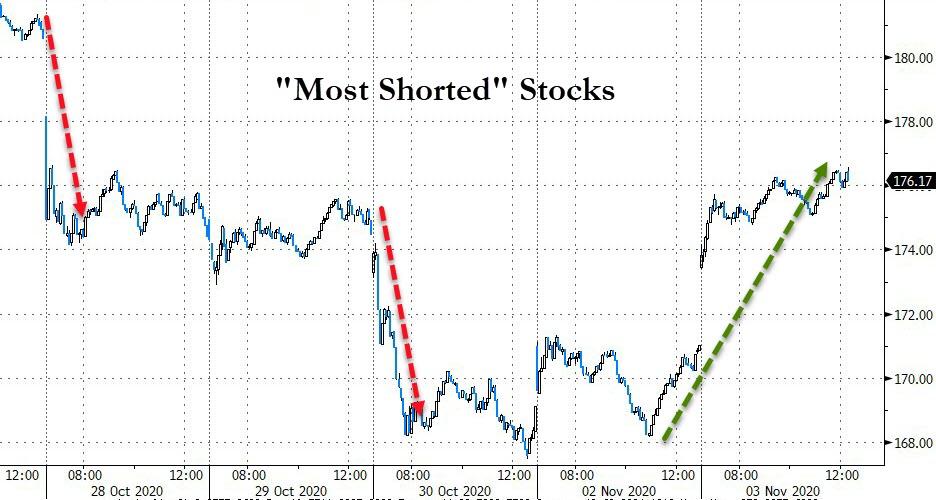
ZH presented an interesting stat in that a rising market has tended to precede a victory for the sitting party 86% of the time since 1928, a theory which proved spot on in 2016:
Amid all the polls showing Hillary Clinton’s dominant lead over Trump, the equity benchmark fell for nine straight days before the election week, cementing its three-month performance into negative territory.
Gold put up a nice performance supported by a falling US Dollar, thereby erasing last week’s plunge and climbing back above its $1,900 level.
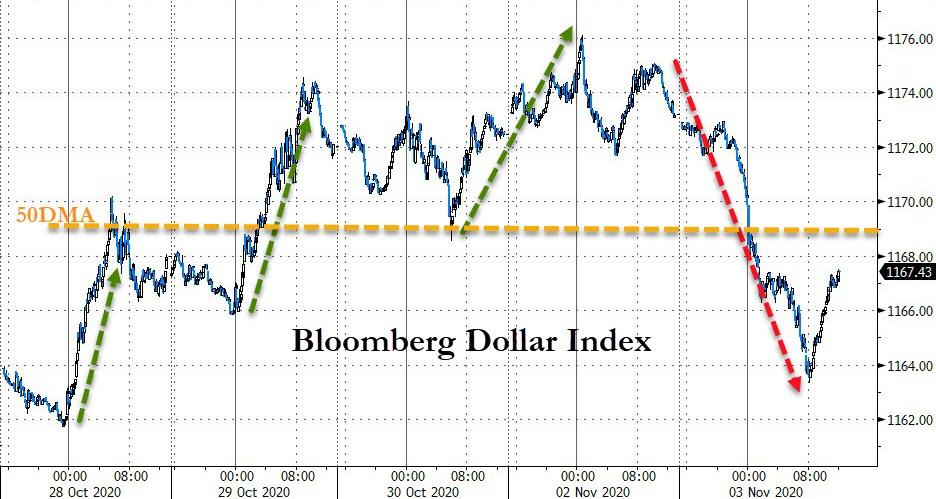
In the end, uncertainty reigns, and should tonight be contested, history from the year 2000 disputed election suggests that bonds will rally while stocks get slammed, according to ZH.
Looking at the big picture in this entire idiocy of fake news and market manipulation, I agree with Buckminster Fuller, who said:
If you take all the machinery in the world and dump it in the ocean, within months more than half of all humanity will die and within another six months they’d almost all be gone; if you took all the politicians in the world, put them in a rocket, and sent them to the moon, everyone would get along fine.
2. ETFs in the Spotlight
In case you missed the announcement and description of this section, you can read it here again.
It features some of the 10 broadly diversified domestic and sector ETFs from my HighVolume list as posted every Saturday. Furthermore, they are screened for the lowest MaxDD% number meaning they have been showing better resistance to temporary sell offs than all others over the past year.
The below table simply demonstrates the magnitude with which these ETFs are fluctuating above or below their respective individual trend lines (%+/-M/A). A break below, represented by a negative number, shows weakness, while a break above, represented by a positive percentage, shows strength.
For hundreds of ETF choices, be sure to reference Thursday’s StatSheet.
For this current domestic “Buy” cycle, here’s how some our candidates have fared:
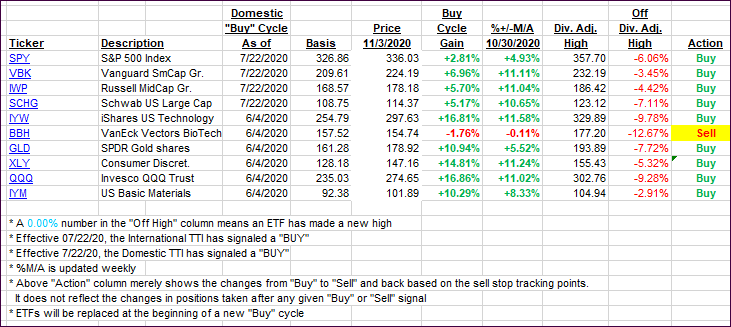
Click image to enlarge
Again, the %+/-M/A column above shows the position of the various ETFs in relation to their respective long-term trend lines, while the trailing sell stops are being tracked in the “Off High” column. The “Action” column will signal a “Sell” once the -8% point has been taken out in the “Off High” column. For more volatile sector ETFs, the trigger point is -10%.
3. Trend Tracking Indexes (TTIs)
Our TTIs spiked with the broad market remaining in recovery mode.
This is how we closed 11/03/2020:
Domestic TTI: +9.82% above its M/A (prior close +7.58%)—Buy signal effective 07/22/2020
International TTI: +4.86% above its M/A (prior close +2.99%)—Buy signal effective 07/22/2020
Disclosure: I am obliged to inform you that I, as well as my advisory clients, own some of the ETFs listed in the above table. Furthermore, they do not represent a specific investment recommendation for you, they merely show which ETFs from the universe I track are falling within the specified guidelines.
Contact Ulli