
- Moving the markets
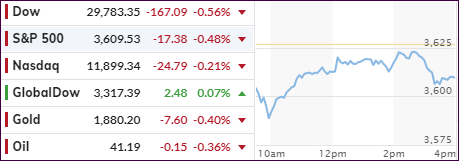
The constant vaccine hype ran out of steam today, with concerns turning to rapidly accelerating economic shutdowns coast-to-coast, which for sure will hammer the US economy and others as well.
As a result, the markets fizzled, but the pullback, while broad, was modest in scope. After all, a pause after the recent ramp into record territory is a normal occurrence.
Contributing to the weakness were poor econ data, as October retail sales disappointed—most likely because of the fading stimulus. However, while the goods and services sales growth slowed YoY, they remain relatively high.
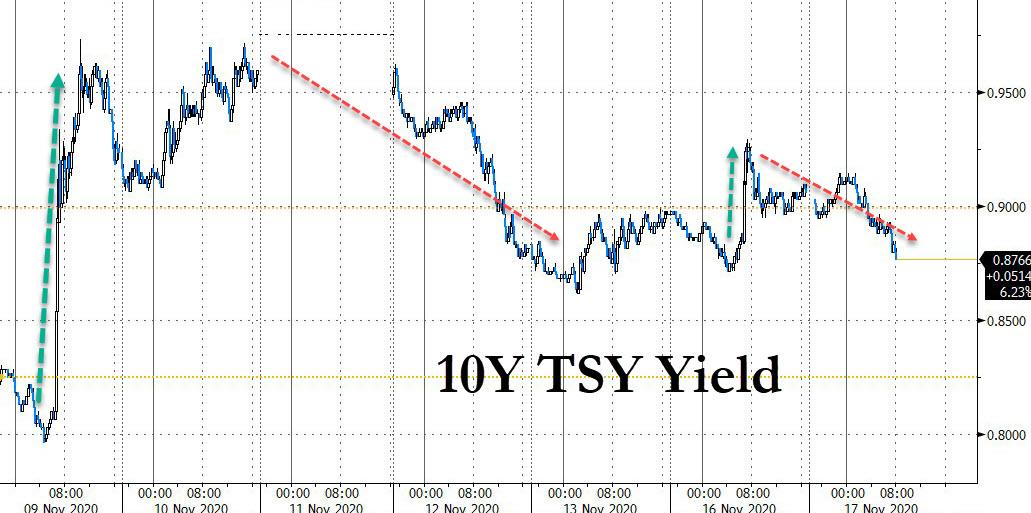
Yesterday’s spike in 10-year bond yields reversed with traders interpreting this as anxieties increasing more about the near-term pandemic challenges than any potential boost from newly developed vaccines.
The US Dollar index slipped a tad, but it was not enough to lend support to gold, which skidded -0.37%.
Fed head Powell took part in a moderated discussion in California and commented as follows:
“The fact that the retail sales were a little weaker in October reinforces the idea that if the pandemic gets worse and there’s more shutdowns and restrictions, that the November data, which we haven’t gotten yet, will be even softer.”
“The near-term risk that we’re most focused on is the spread of COVID these days.”
“We’re not going back to the same economy. We’re going back to a different economy, the time for fiscal discipline is not now.“
Especially his last sentence should be a wake-up call for investors because it is the main reason, I believe gold should be a part of anyone’s portfolio.
2. ETFs in the Spotlight
In case you missed the announcement and description of this section, you can read it here again.
It features some of the 10 broadly diversified domestic and sector ETFs from my HighVolume list as posted every Saturday. Furthermore, they are screened for the lowest MaxDD% number meaning they have been showing better resistance to temporary sell offs than all others over the past year.
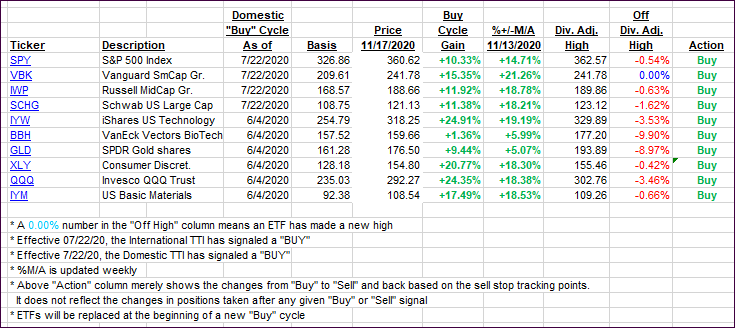
The below table simply demonstrates the magnitude with which these ETFs are fluctuating above or below their respective individual trend lines (%+/-M/A). A break below, represented by a negative number, shows weakness, while a break above, represented by a positive percentage, shows strength.
For hundreds of ETF choices, be sure to reference Thursday’s StatSheet.
For this current domestic “Buy” cycle, here’s how some our candidates have fared:
Click image to enlarge
Again, the %+/-M/A column above shows the position of the various ETFs in relation to their respective long-term trend lines, while the trailing sell stops are being tracked in the “Off High” column. The “Action” column will signal a “Sell” once the -8% point has been taken out in the “Off High” column. For more volatile sector ETFs, the trigger point is -10%.
3. Trend Tracking Indexes (TTIs)
Our TTIs paused, as the major indexes made no headway today.
This is how we closed 11/17/2020:
Domestic TTI: +19.58% above its M/A (prior close +19.86%)—Buy signal effective 07/22/2020
International TTI: +16.57% above its M/A (prior close +16.54%)—Buy signal effective 07/22/2020
Disclosure: I am obliged to inform you that I, as well as my advisory clients, own some of the ETFs listed in the above table. Furthermore, they do not represent a specific investment recommendation for you, they merely show which ETFs from the universe I track are falling within the specified guidelines.
Contact Ulli