
- Moving the markets
The tug-of-war between vaccine giants Pfizer and Moderna shifted into overdrive with the former now besting the latter by pointing to its final analysis, which verified a 95% effective rate vs. Moderna’s previous 92%. I am sure that we have not heard the last of it.
The news of that advancement was offset by rising Covid-19 cases and coast-to-coast lockdowns and restrictions, some of which are worrisome due to their open-ended nature.
For sure, the markets had gotten ahead of themselves after the initial vaccine news with the question now being “when” regarding availability. Still, some of the long-term uncertainty has been removed.
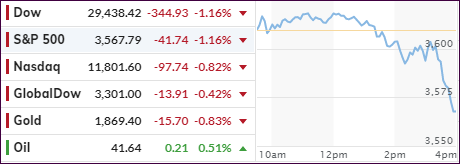
An early rally bit the dust, and the bears took the opportunity to drive the indexes into the red, in the process losing all their week’s gains, and closing at the day’s lows.
Chimed in BofAs CIO Michael Hartnett:
“It’s time to turn bearish for the near-term and “sell the vaccine” because Wall Street has gone “full bull.”
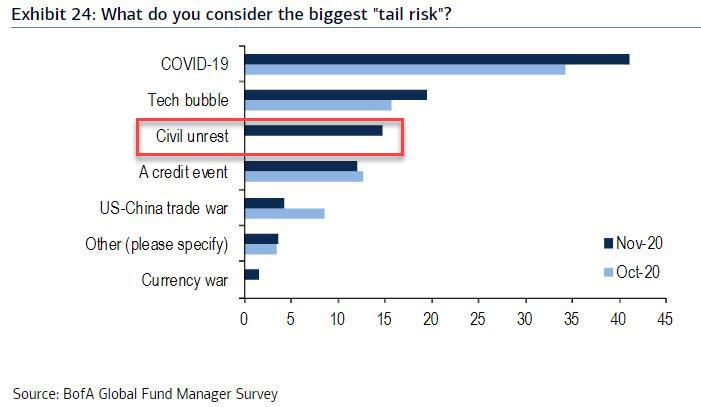
With the election outcome still undecided, ZeroHedge dug in a little deeper into Wall Street’s admission that “Civil Unrest” could crash markets:
… what we found remarkable is that after “tech bubble” in 2nd place in the list of biggest tail risks, “Civil Unrest” suddenly popped into 3rd place, after not being cited as a notable risk in any of the previous BofA surveys.
What that means is that despite reckless money printing and creation of liquidity coupled with the lowest interest rates ever, a Black Swan event could appear out of nowhere and take the markets down—big time.
Hence my continuous and unending insistence that you never expose yourself to equities without an adequate exit strategy that addresses your risk tolerance. Complacency and hope are not viable investment approaches.
2. ETFs in the Spotlight
In case you missed the announcement and description of this section, you can read it here again.
It features some of the 10 broadly diversified domestic and sector ETFs from my HighVolume list as posted every Saturday. Furthermore, they are screened for the lowest MaxDD% number meaning they have been showing better resistance to temporary sell offs than all others over the past year.
The below table simply demonstrates the magnitude with which these ETFs are fluctuating above or below their respective individual trend lines (%+/-M/A). A break below, represented by a negative number, shows weakness, while a break above, represented by a positive percentage, shows strength.
For hundreds of ETF choices, be sure to reference Thursday’s StatSheet.
For this current domestic “Buy” cycle, here’s how some our candidates have fared:
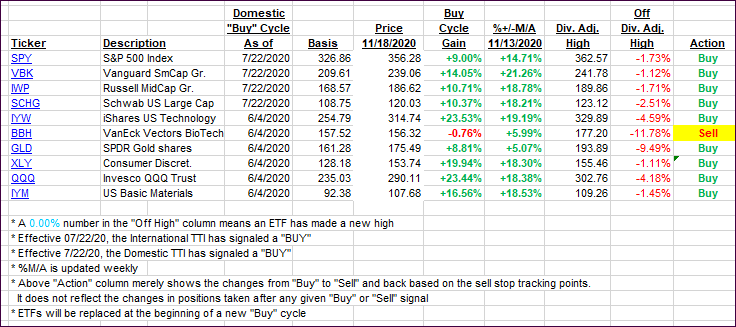
Click image to enlarge
Again, the %+/-M/A column above shows the position of the various ETFs in relation to their respective long-term trend lines, while the trailing sell stops are being tracked in the “Off High” column. The “Action” column will signal a “Sell” once the -8% point has been taken out in the “Off High” column. For more volatile sector ETFs, the trigger point is -10%.
3. Trend Tracking Indexes (TTIs)
Our TTIs came off their 30-year highs as the bearish crowd controlled market direction for most of the day.
This is how we closed 11/18/2020:
Domestic TTI: +18.16% above its M/A (prior close +19.58%)—Buy signal effective 07/22/2020
International TTI: +16.00% above its M/A (prior close +16.57%)—Buy signal effective 07/22/2020
Disclosure: I am obliged to inform you that I, as well as my advisory clients, own some of the ETFs listed in the above table. Furthermore, they do not represent a specific investment recommendation for you, they merely show which ETFs from the universe I track are falling within the specified guidelines.
Contact Ulli