
- Moving the markets
The futures were again directing the way via an ecstatic “hope” move in the markets with ZH narrating it this way:
Last night, when discussing the euphoric surge in Sunday markets, we said that the move is on expectations that the “Moderna covid vaccine may hit as early as tomorrow, and a favorable outcome would have a similar result to last Monday’s Pfizer surprise which sent the S&P as high as 3,668 before fading much of the losses.”
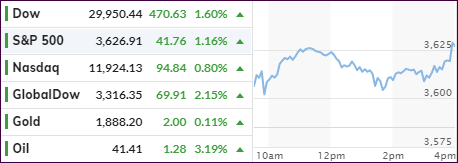
This observation was spot on, and today we saw Moderna pick up the baton handed to them by Pfizer, which pushed futures higher. The theme continued in the regular session with the major indexes heading north without looking back.
The Dow lead the way but fell short of claiming the $30k level, the S&P 500 placed 2nd and the Nasdaq lagged a little. Both, the Dow and S&P closed in record territory.
Shattering Pfizer’s effectiveness claim of 92%, Moderna upped the ante via an effective rate of 94%, so the tug-of-war will continue. However, the ever-optimistic traders see the Covid crises now as something that might be more manageable, thereby assisting future earnings and justifying elevated stock prices.
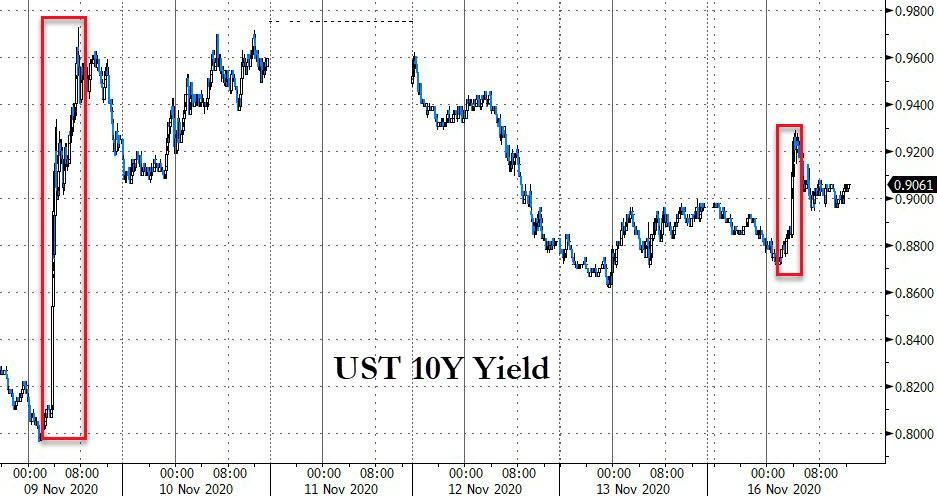
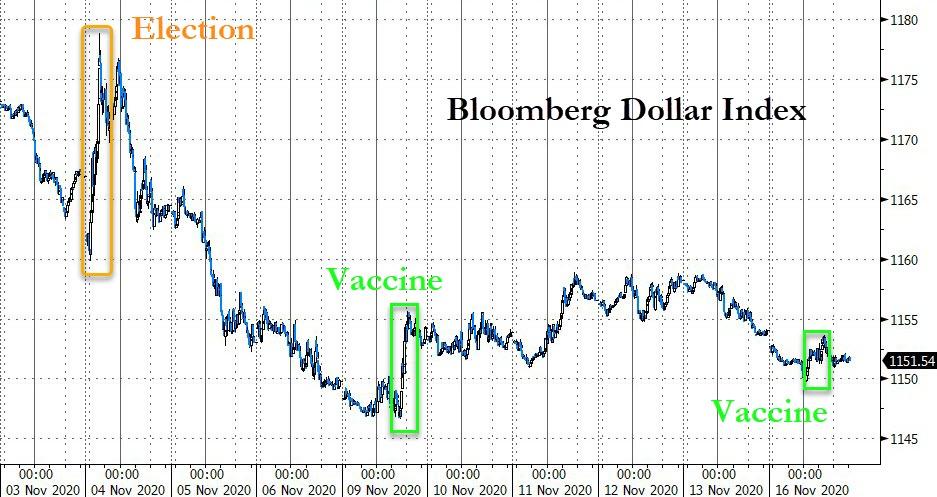
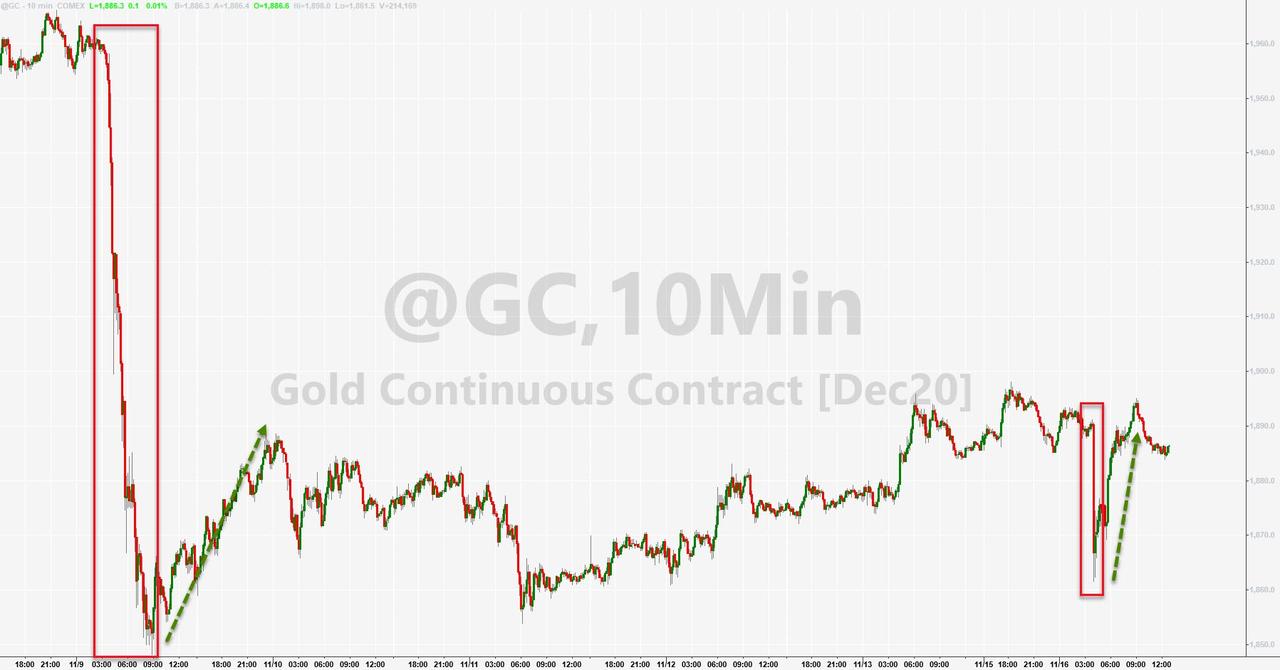
The 10-year bond yield inched higher, while the US dollar index also climbed, both of which took the steam out of an early bounce in gold.
With all that enthusiasm, one group of investors, surely and quietly continue to exit the markets, namely the “Smart Money:”
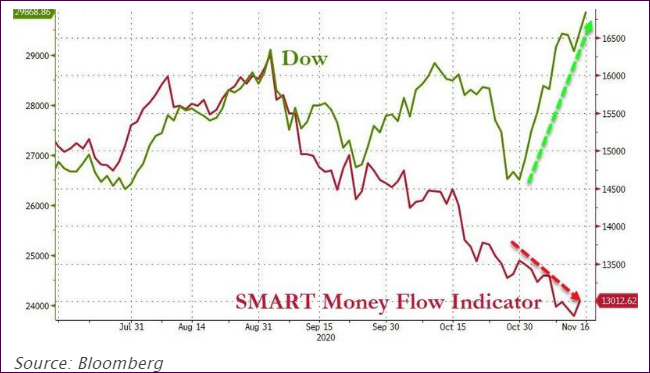
It makes me wonder what these people know that traders don’t.
2. ETFs in the Spotlight
In case you missed the announcement and description of this section, you can read it here again.
It features some of the 10 broadly diversified domestic and sector ETFs from my HighVolume list as posted every Saturday. Furthermore, they are screened for the lowest MaxDD% number meaning they have been showing better resistance to temporary sell offs than all others over the past year.
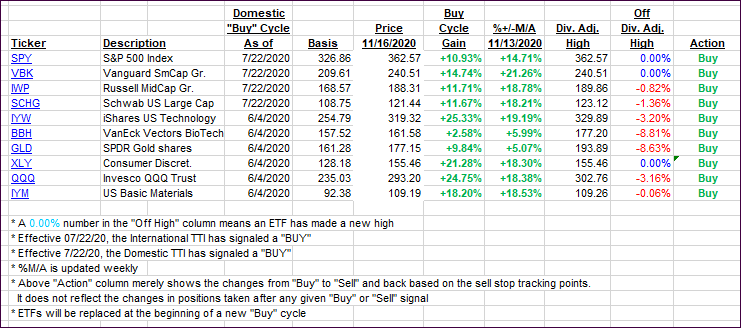
The below table simply demonstrates the magnitude with which these ETFs are fluctuating above or below their respective individual trend lines (%+/-M/A). A break below, represented by a negative number, shows weakness, while a break above, represented by a positive percentage, shows strength.
For hundreds of ETF choices, be sure to reference Thursday’s StatSheet.
For this current domestic “Buy” cycle, here’s how some our candidates have fared:
Click image to enlarge
Again, the %+/-M/A column above shows the position of the various ETFs in relation to their respective long-term trend lines, while the trailing sell stops are being tracked in the “Off High” column. The “Action” column will signal a “Sell” once the -8% point has been taken out in the “Off High” column. For more volatile sector ETFs, the trigger point is -10%.
3. Trend Tracking Indexes (TTIs)
Our TTIs ramped higher again with the Domestic one scoring a new all-time high close, while the International one is within striking distance of doing the same.
This is how we closed 11/16/2020:
Domestic TTI: +19.86% above its M/A (prior close +17.41%)—Buy signal effective 07/22/2020
International TTI: +16.54% above its M/A (prior close +14.17%)—Buy signal effective 07/22/2020
Disclosure: I am obliged to inform you that I, as well as my advisory clients, own some of the ETFs listed in the above table. Furthermore, they do not represent a specific investment recommendation for you, they merely show which ETFs from the universe I track are falling within the specified guidelines.
Contact Ulli