
- Moving the markets
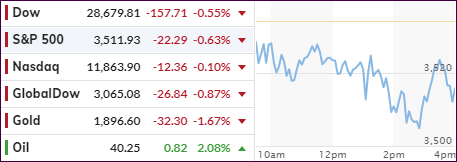
Equities headed south right after the opening bell with the Dow ending its 4-day win streak. Bringing the recent rally to a halt was news that several pharmaceutical companies were facing challenges with their Covid-19 vaccines due to side effects causing 2 companies to pause its trials.
Earnings season got started with banking giant JP Morgan delivering better-than-expected earnings but slightly weaker than expected revenues. One of the items that made me go “Hmm…” was their reduction in loan loss provisions, which dropped by 90%. As if potential future loan losses no longer are of any concern…
Also not helping the mood on Wall Street were the stalled talks in Congress with another coronavirus stimulus package questionable, as the warring parties appear in no mood for any concessions.
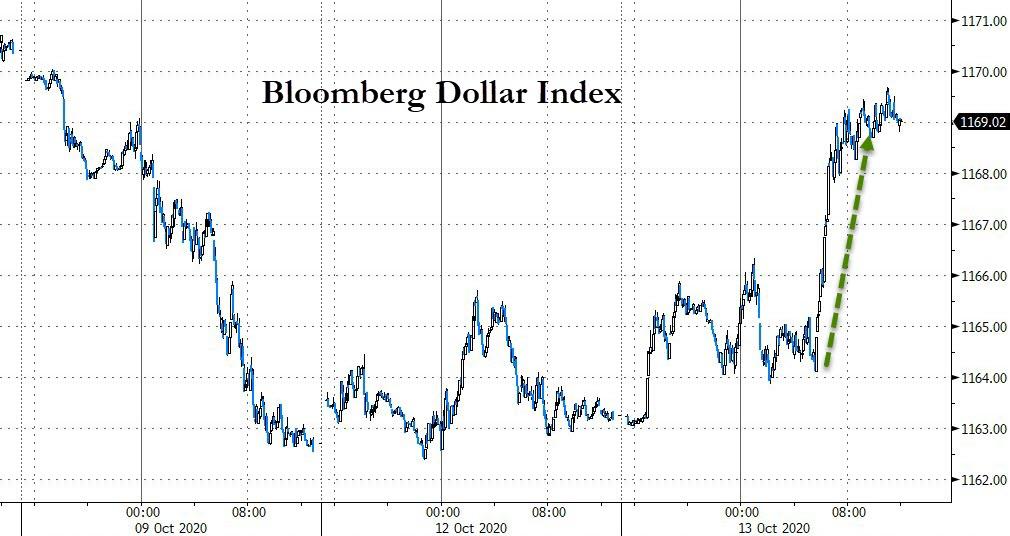
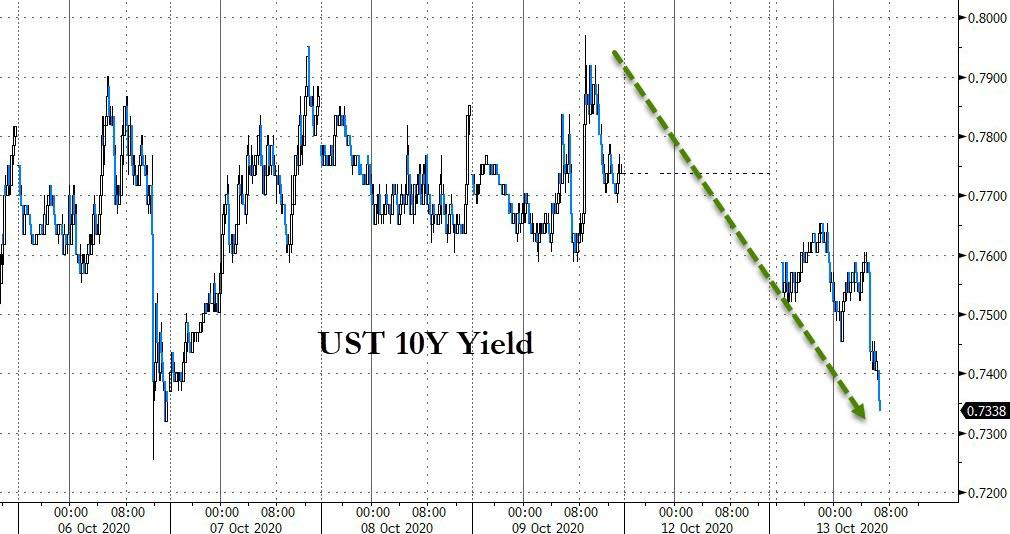
Precious metals got hammered today as the dollar spiked with gold trying to hang on to its $1,900 level, while bonds rallied as yields fell.
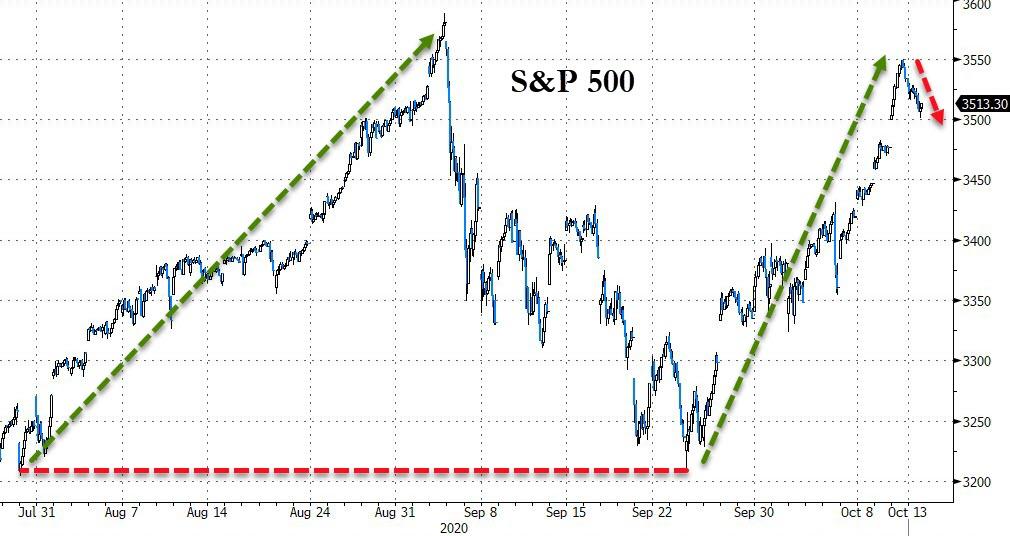
The Nasdaq fared the best among the major indexes, while the S&P 500 was unable to keep recent upward momentum going and therefore failed to take out its recent highs.
In the end, it was a whipsaw day with nothing gained but not much lost either.
2. ETFs in the Spotlight
In case you missed the announcement and description of this section, you can read it here again.
It features some of the 10 broadly diversified domestic and sector ETFs from my HighVolume list as posted every Saturday. Furthermore, they are screened for the lowest MaxDD% number meaning they have been showing better resistance to temporary sell offs than all others over the past year.
The below table simply demonstrates the magnitude with which these ETFs are fluctuating above or below their respective individual trend lines (%+/-M/A). A break below, represented by a negative number, shows weakness, while a break above, represented by a positive percentage, shows strength.
For hundreds of ETF choices, be sure to reference Thursday’s StatSheet.
For this current domestic “Buy” cycle, here’s how some our candidates have fared:
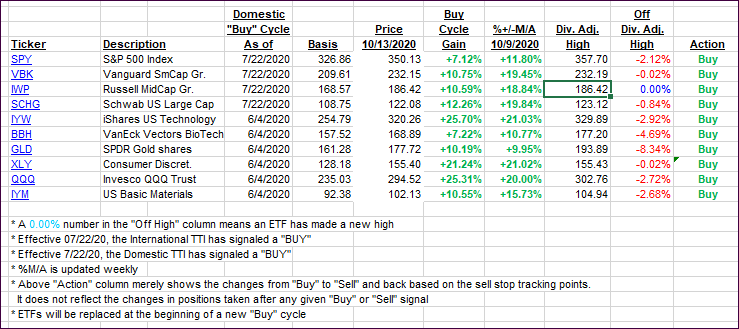
Click image to enlarge
Again, the %+/-M/A column above shows the position of the various ETFs in relation to their respective long-term trend lines, while the trailing sell stops are being tracked in the “Off High” column. The “Action” column will signal a “Sell” once the -8% point has been taken out in the “Off High” column. For more volatile sector ETFs, the trigger point is -10%.
3. Trend Tracking Indexes (TTIs)
Our TTIs pulled back as the major indexes corrected.
This is how we closed 10/13/2020:
Domestic TTI: +10.68% above its M/A (prior close +11.80%)—Buy signal effective 07/22/2020
International TTI: +6.83% above its M/A (prior close +7.74%)—Buy signal effective 07/22/2020
Disclosure: I am obliged to inform you that I, as well as my advisory clients, own some of the ETFs listed in the above table. Furthermore, they do not represent a specific investment recommendation for you, they merely show which ETFs from the universe I track are falling within the specified guidelines.
Contact Ulli